The Industry's Most Comprehensive View of CTV Trends

Streaming Analytics provides an unbiased and unified perspective on how people really watch CTV.

Discover How, Where, and What People Watch on CTV

TVision measures and reports on:

all devices_navy

All Devices

Understand how viewers access streaming content on their TVs

hundreds of apps_navy

Hundreds of Apps

Get insight into the full spectrum of apps, including CTV walled gardens

Thousands of Shows_navy

Thousands of Shows

Identify the most popular content trends across all CTV platforms

Answer Key Questions

  • What CTV devices, apps, and shows are popular?
  • How is share shifting between devices and apps?
  • Which ad lengths perform best in any given app?
  • What is the co-viewing rate for an app? 
  • How do demos vary across apps and shows?
  • Is a new show or season successful? 
  • And more...

To get answers to your specific questions contact us.

We Make it Easy to Get the Info You Need

TVision’s Streaming Analytics platform is organized into multiple dashboards that provide both high-level views and detailed metrics on the CTV landscape.

Device & App Landscapes

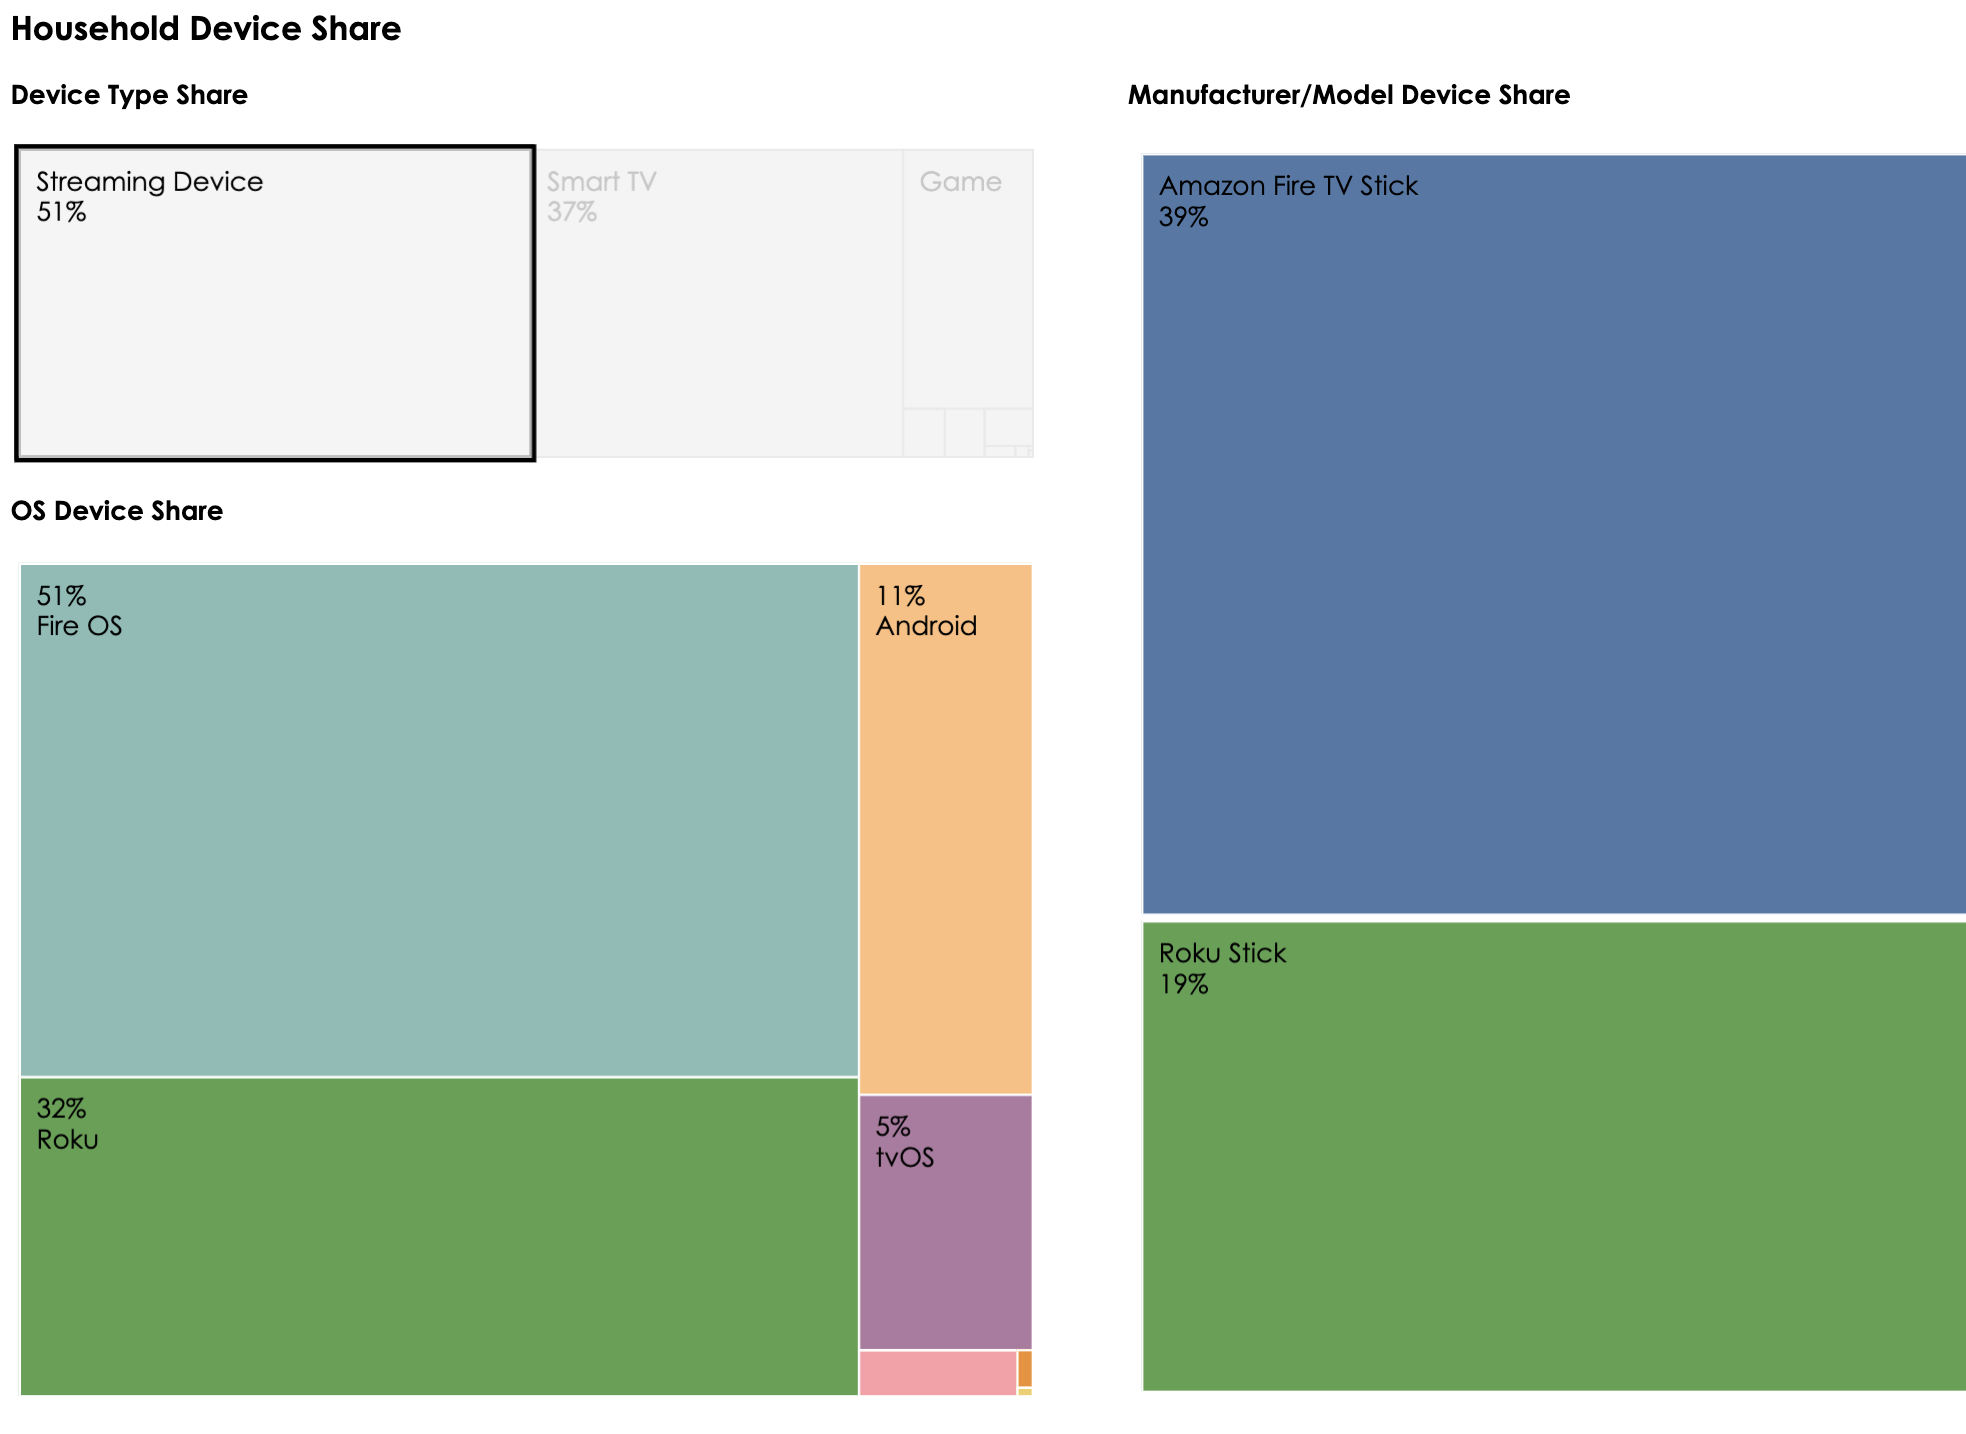
Find out how people are accessing CTV content. 

These dynamic dashboards illustrate device and app scale and provide a view of real-world CTV adoption rates. Uncover insights such as:

  • The distribution between AVOD & SVOD apps
  • The number of devices per household
  • Share of time spent with each app
  • And more...

App & Program Rankers

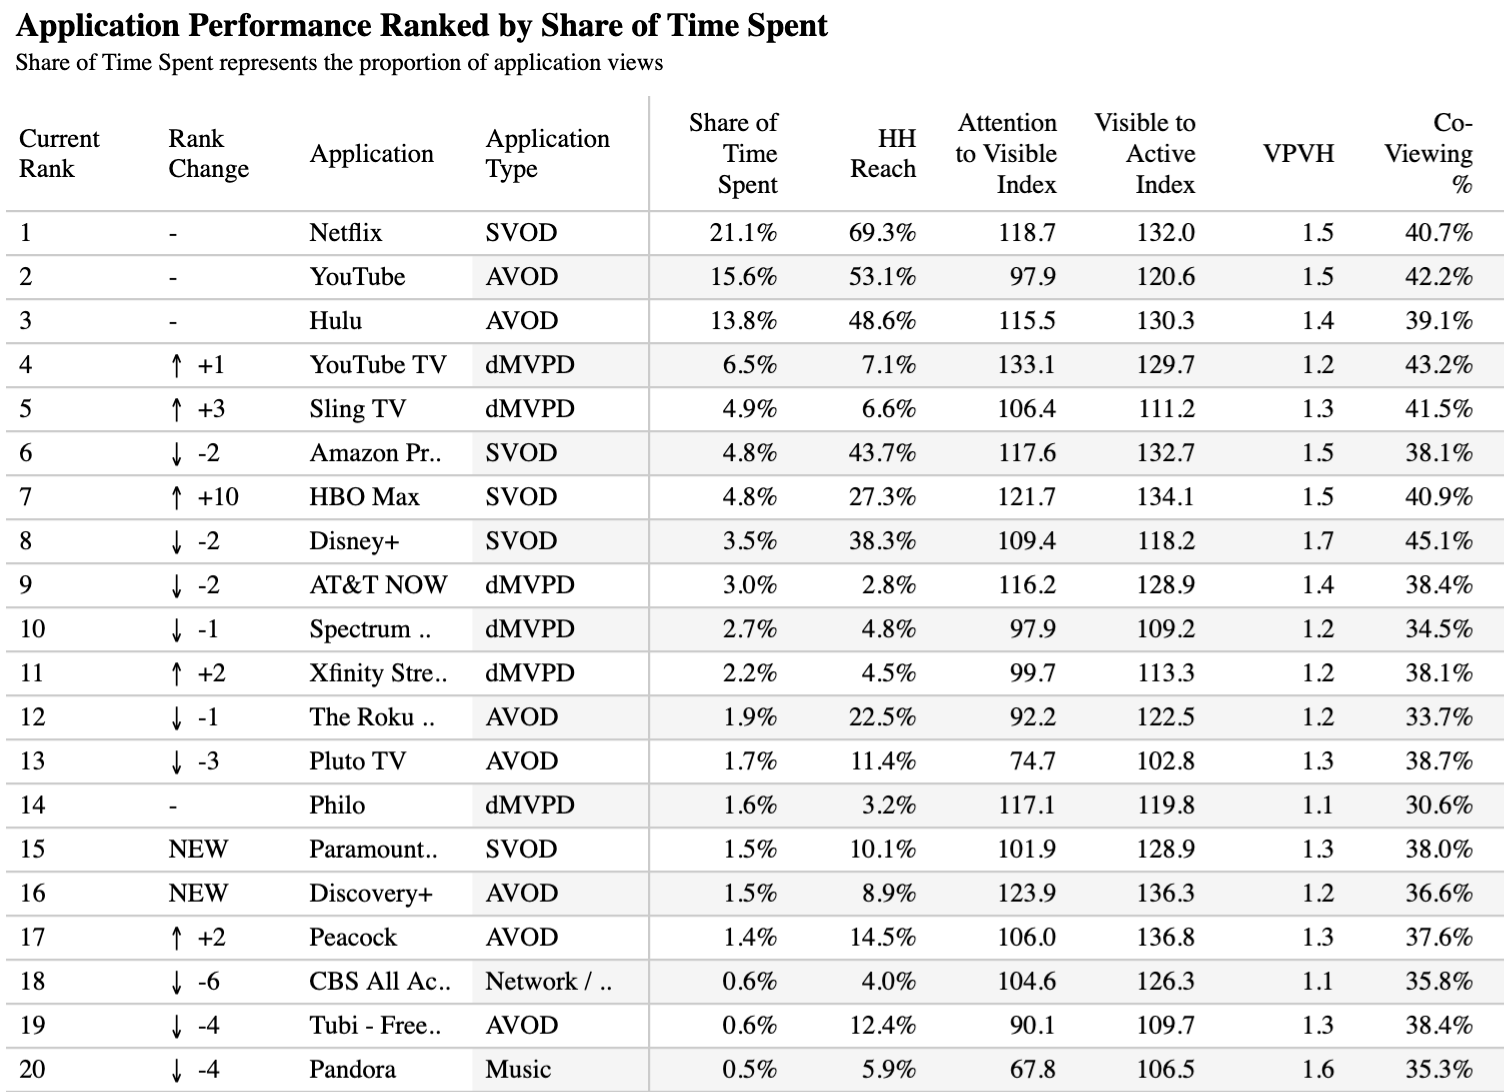
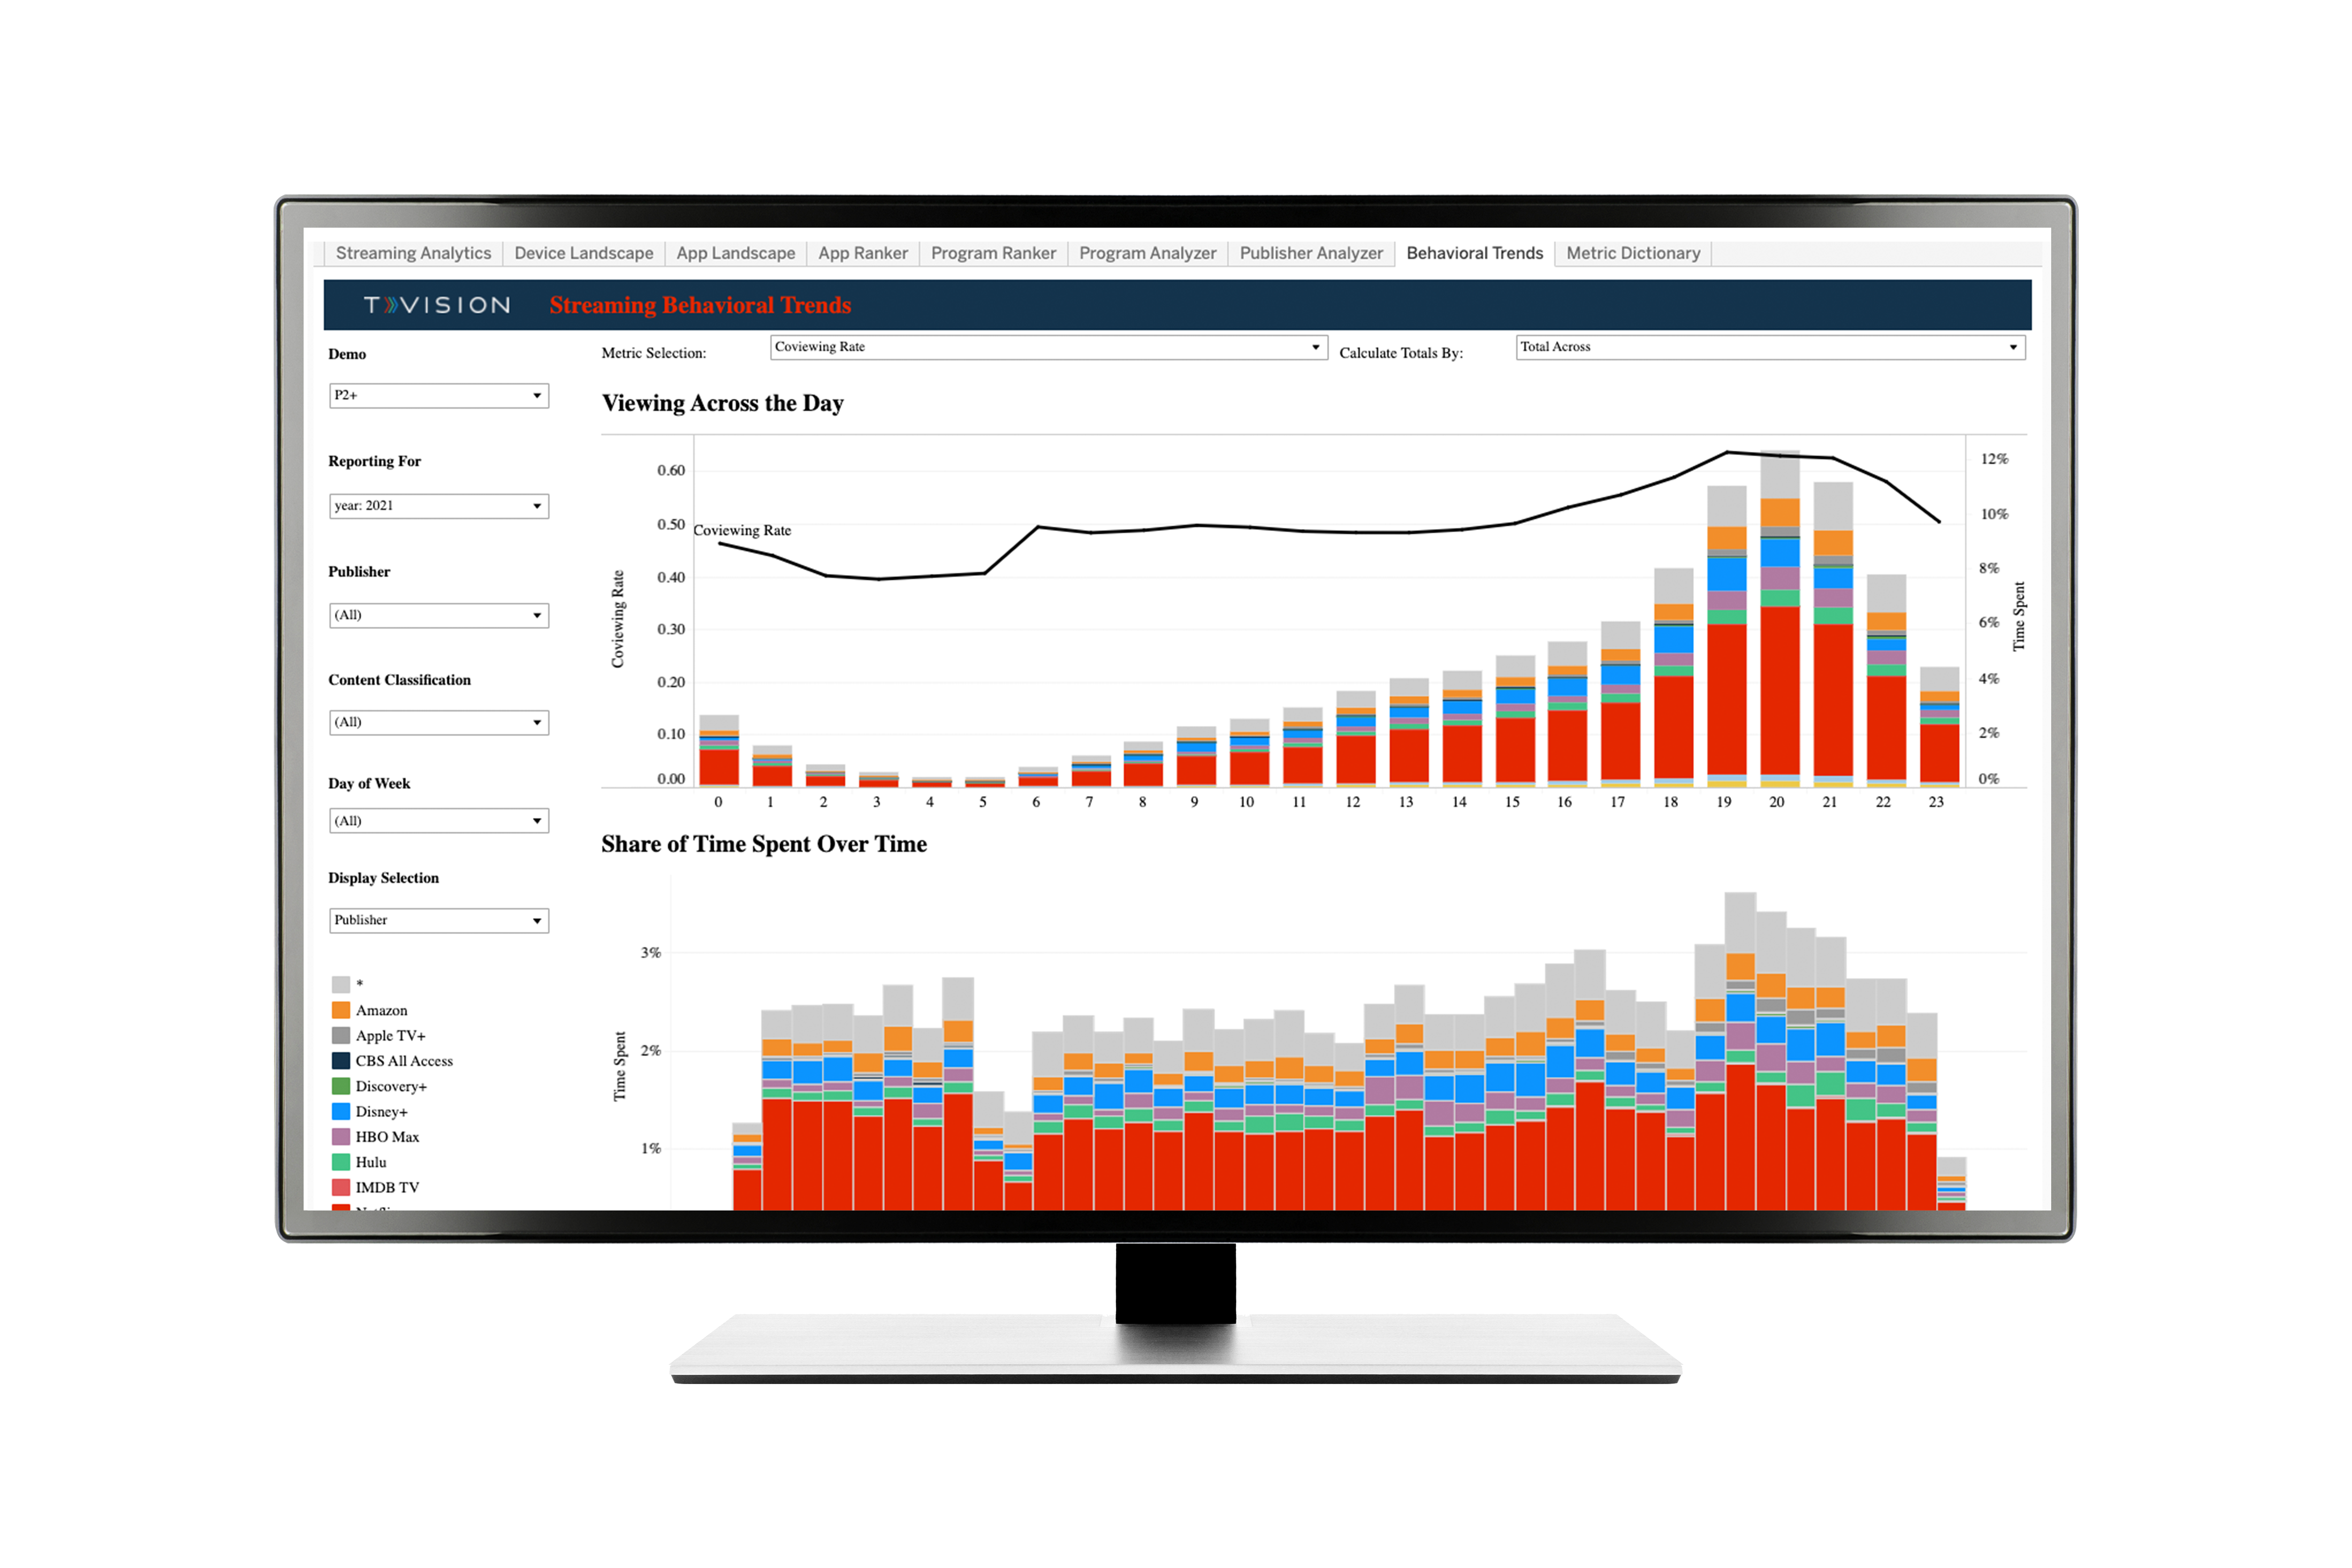
Get insight into what people are watching on CTV.

These rankings demonstrate shifts in popularity and enable quick comparisons of KPIs such as: 

  • Share of time spent
  • Coviewing rates 
  • Audience engagement with both content and ads
  • And more...

Audience & Behavioral Trends

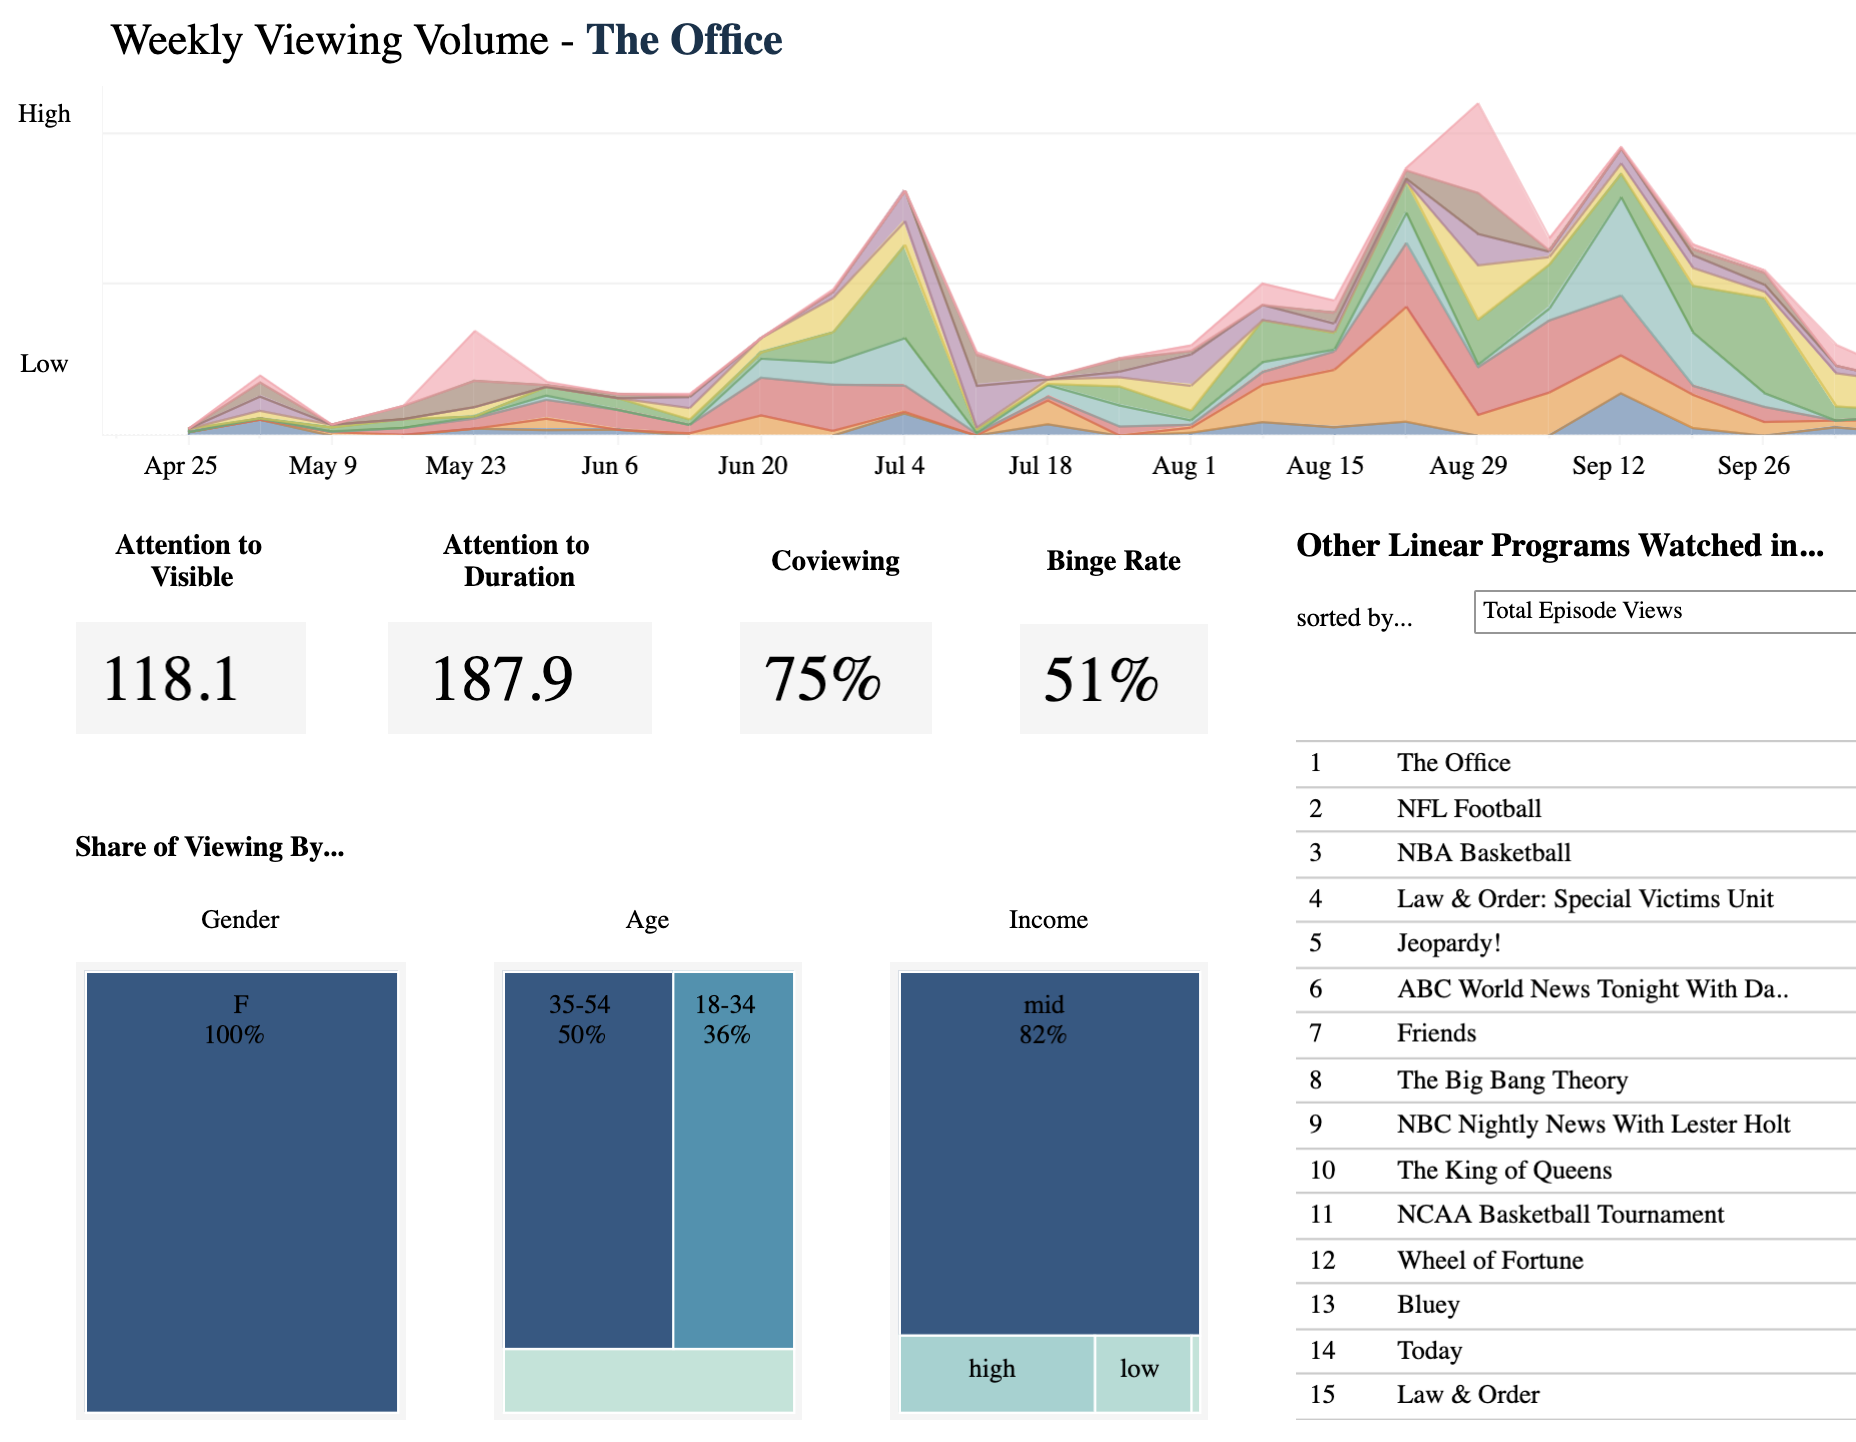
Better understand who is watching CTV apps and shows, and how those trends change over time. 

These detailed dashboards provide demographic insights and highlight how audiences are spending their time. Discover: 

  • Viewer demographics for specific shows
  • App engagement rates by audience
  • Hourly viewing trends for apps


Trusted By Top Brands & Media Platforms
ABInBev logo
Mars Logo
Pepsi Co Logo
duracell logo
A and E Networks Precision plus Performance stacked logos
microsoft-logo
google-logo
AMC Networks logo
hulu logo
roku logo
FOX logo
Ebiquity logo
Measure Everything That Comes Across the Glass

TVision’s single-panel approach, in-home technology, and deep library of content enable apples-to-apples comparisons across both linear and CTV. Here's how it works:

ACR
We use ACR to match what’s playing on the screen to our ever-expanding library of content and ads.
CTV Devices
We detect which app and streaming device is in use - we see all CTV devices, smart TVs, and gaming consoles.
watching CTV
We combine the data sets to report who is watching what program, on which app, and through which device.


Because we use the same methodology for both linear and CTV measurement, we can provide a unified set of metrics that enable a better understanding of TV consumption in the streaming age. 

LearnMoreAboutLinearTVMeasurement_link


Get a Demo

Send us a message and we’ll get back to you ASAP.