Over the last few years, the CTV industry has increasingly moved to more ad-supported models, but are viewers following suit and embracing apps with ads? And if so, how can advertisers make the most of the growing opportunities to get their brand in front of this audience?
At TVision, we’ve been tracking the answers to these questions and more in our State of CTV Advertising Report. This bi-annual series explores key trends in CTV viewer engagement that are shaping the future of the industry. In our latest report, we found that the future of CTV is indeed ad supported. Here are just a few must-know insights into the rise of ad-supported models from our report:
The amount of time Americans spend on Ad-Supported Apps such as YouTube and Hulu is rapidly increasing. In the second half of 2022, 48% of Time Spent Viewing CTV went to Ad-Supported Apps (up 55% from the end of 2020) and just 26% to SVOD (down 30%).
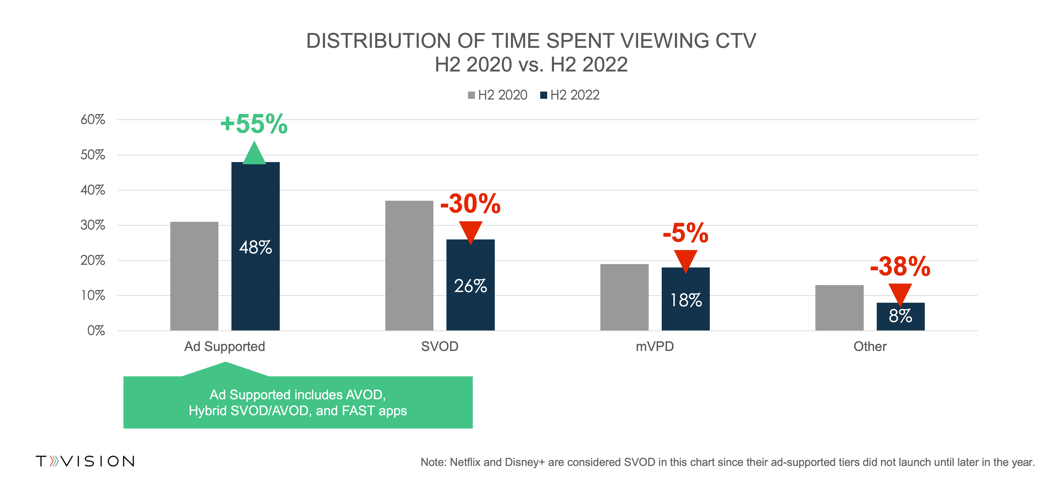
In the chart above, the Ad-Supported category includes applications with ad-supported tiers available such as AVODs, Hybrid apps that offer both premium subscriptions and Ad-Supported tiers, and free ad-supported streaming television (FAST apps). Although Netflix and Disney+ both surprised the industry last year and launched ad-supported tiers in the back half of 2022, we are still including them in the SVOD bucket as these apps did not have ad tiers available for the majority of 2022.
As the landscape continues to shift to more ad-supported models, we expect viewers to spend more time with apps that offer ad-friendly subscription tiers.
Although 2022 saw many shifts in how CTV viewers spend their time, the sharp upticks in app adoption seen just a year two ago have finally settled. Many of the big apps that typically garner high household reach like Netflix and Hulu saw a decline in household reach in the back half of the year. Meanwhile, FAST apps Roku and Tubi saw an increase.
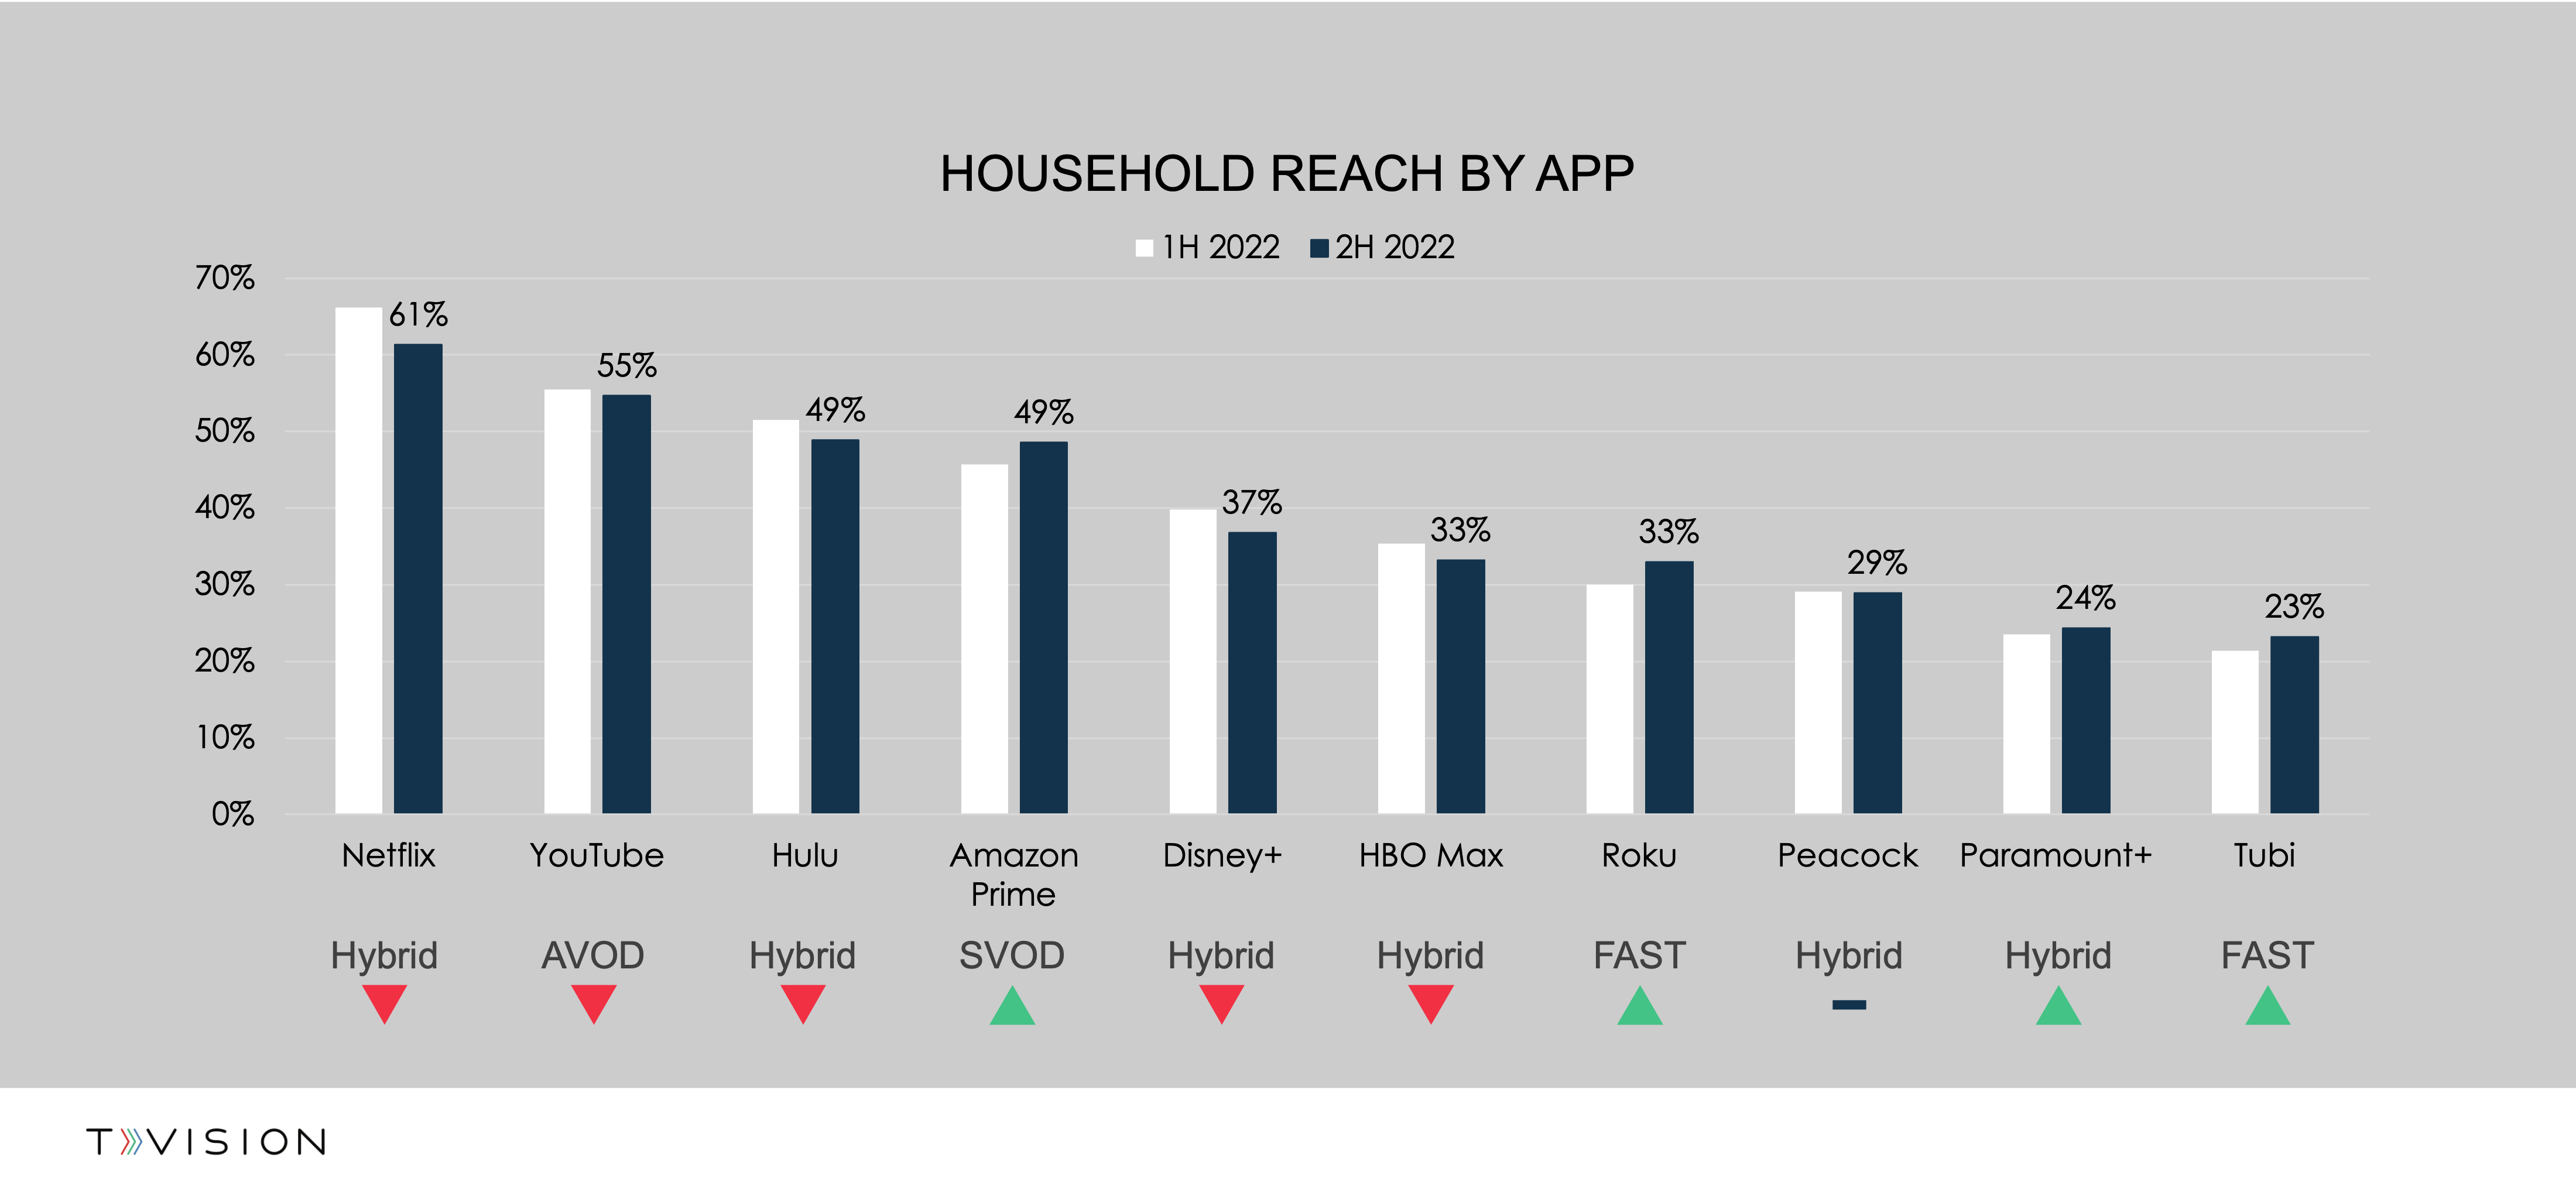
This trend is reflected in the number of CTV-enabled households, which remained steady at 83% between the first and second half of 2022. Similarly, the number of apps viewers actually watch has also remained consistent and notably lower than during the peak pandemic highs. Households have gone from watching an average of 7.7 apps in Q4 2020 to 7.3 in 2022, while the number with 10 or more apps hovers at 29%.
With CTV no longer growing as quickly, it’s essential that advertisers leverage insights into reach and viewer engagement to maximize value within CTV. Models need to improve, and publishers need to figure out new ways to generate growth.
Just because someone opens an application doesn’t mean they’re staying tuned in. We also explored the distribution of time spent by application and how that has changed from the front half of the year to the back half.
Netflix may be bringing in more monthly viewers, but interestingly, they are no longer the leader in capturing share of time spent. We saw YouTube, which previously sat behind Netflix, jump to the front of the list of most-used apps. Time spent with YouTube grew 7% since the first half of 2022 while Netflix’s share of time spent has decreased by 10%. It will be interesting to see if long-tail content on YouTube continues to compete with the high-quality and expensive content developed by apps such as Netflix in the months to come.
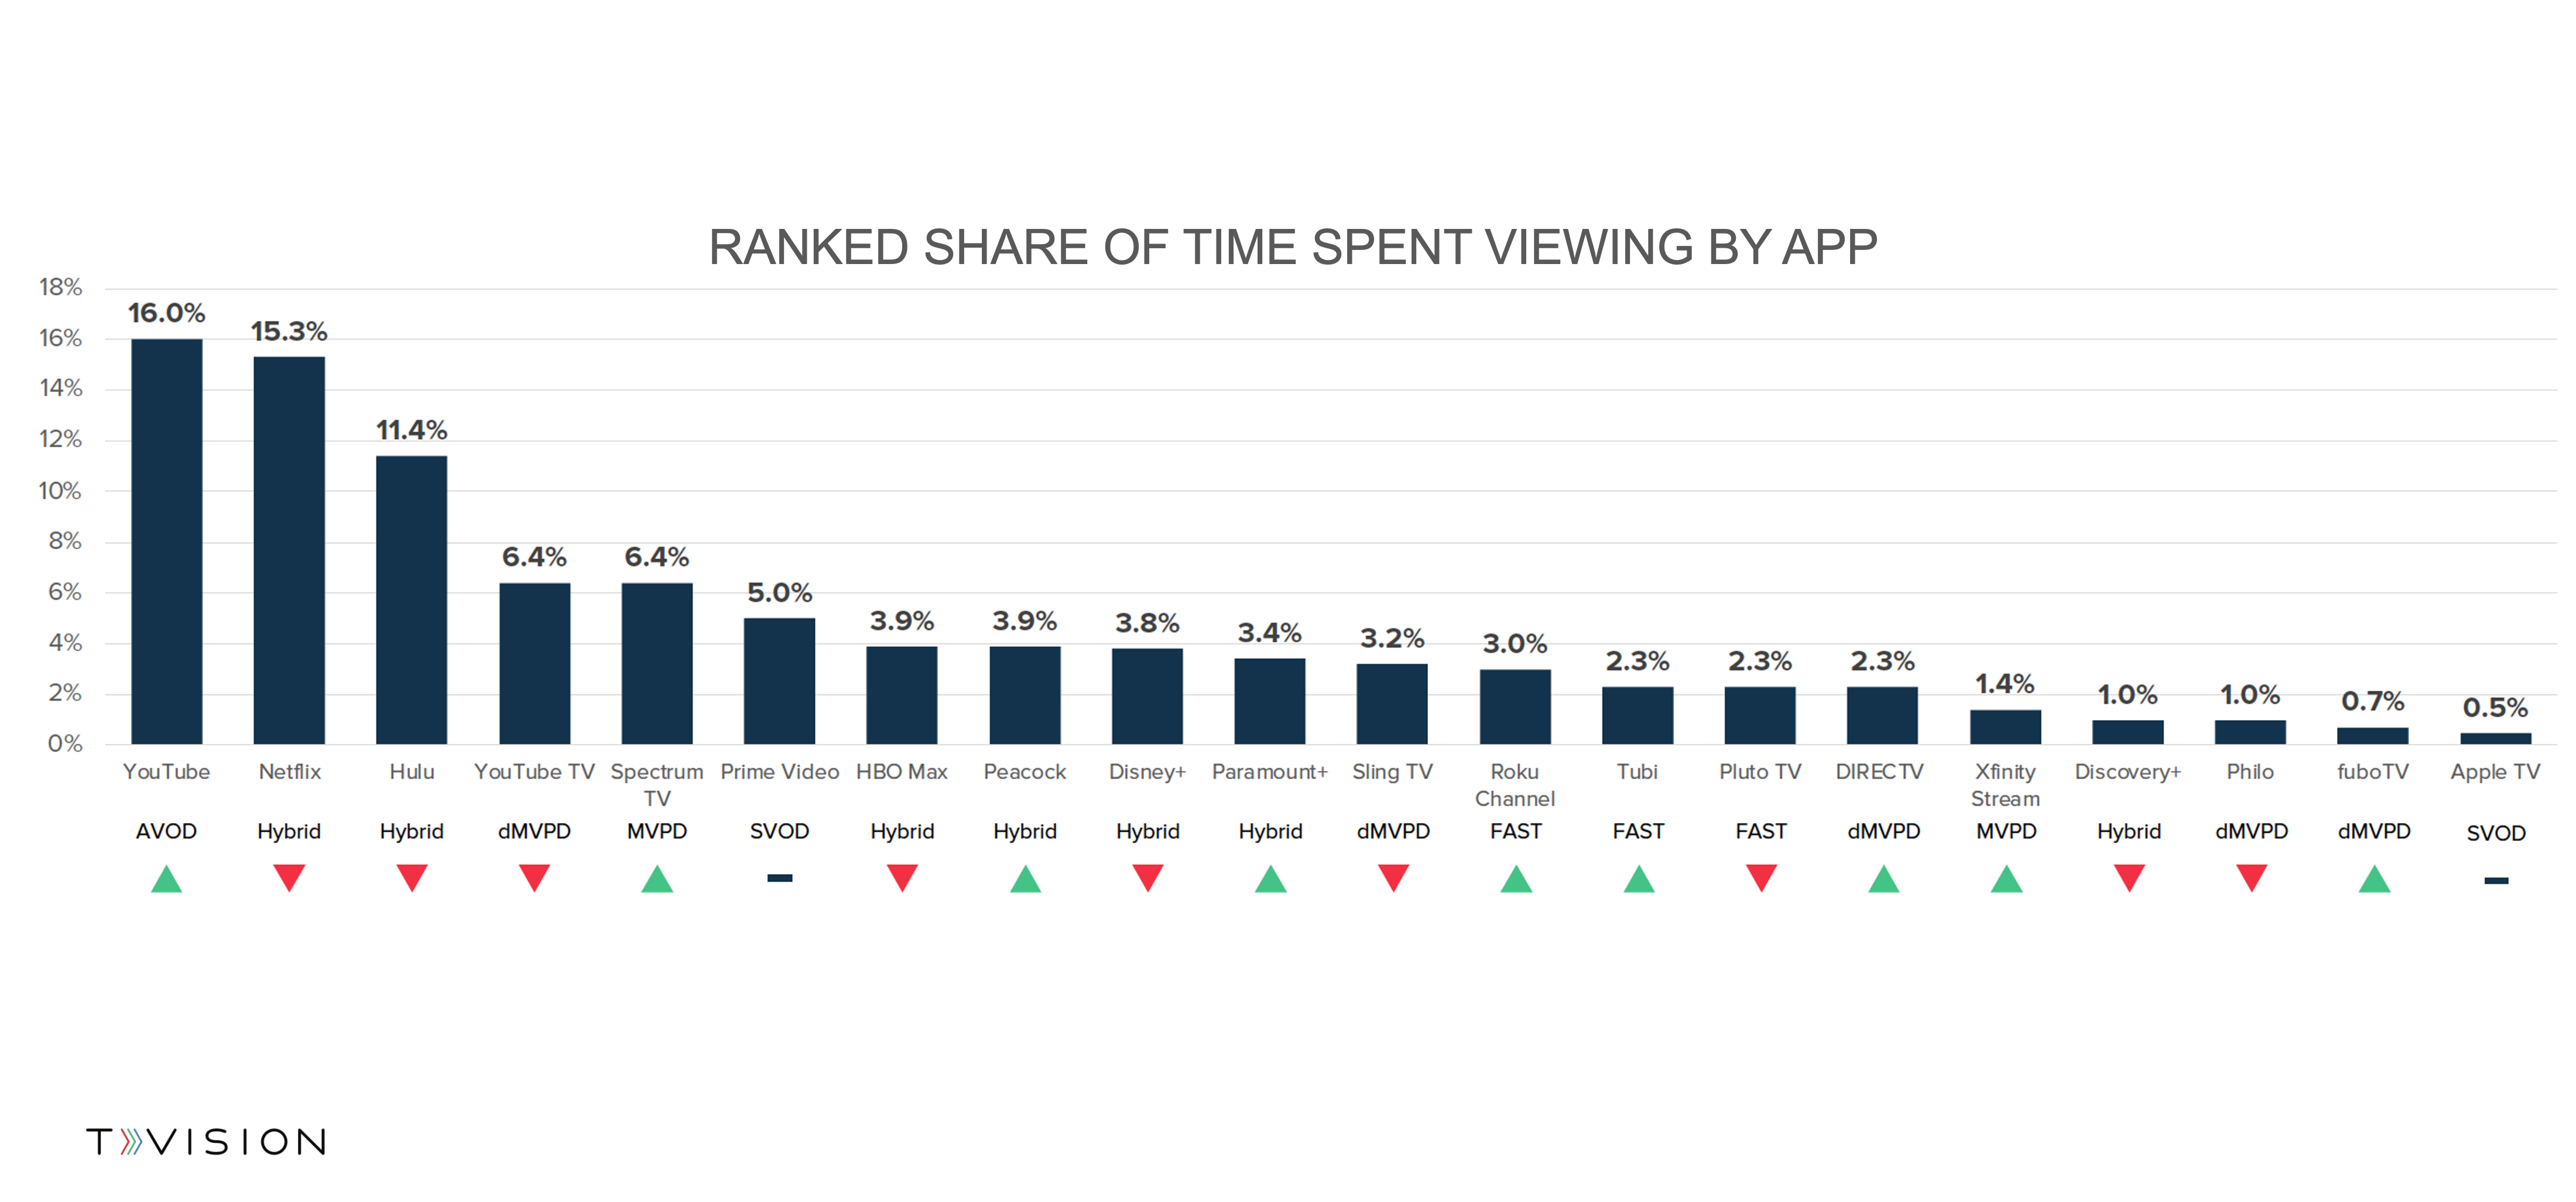
Also notable, similar to household reach, we saw that larger applications have decreased in time spent compared to the front half of the year, and FAST apps such as Pluto, Tubi, and The Roku Channel all also experienced significant increases in Share of Time Spent Viewing. We’ll dive more into FAST Apps in the next section.
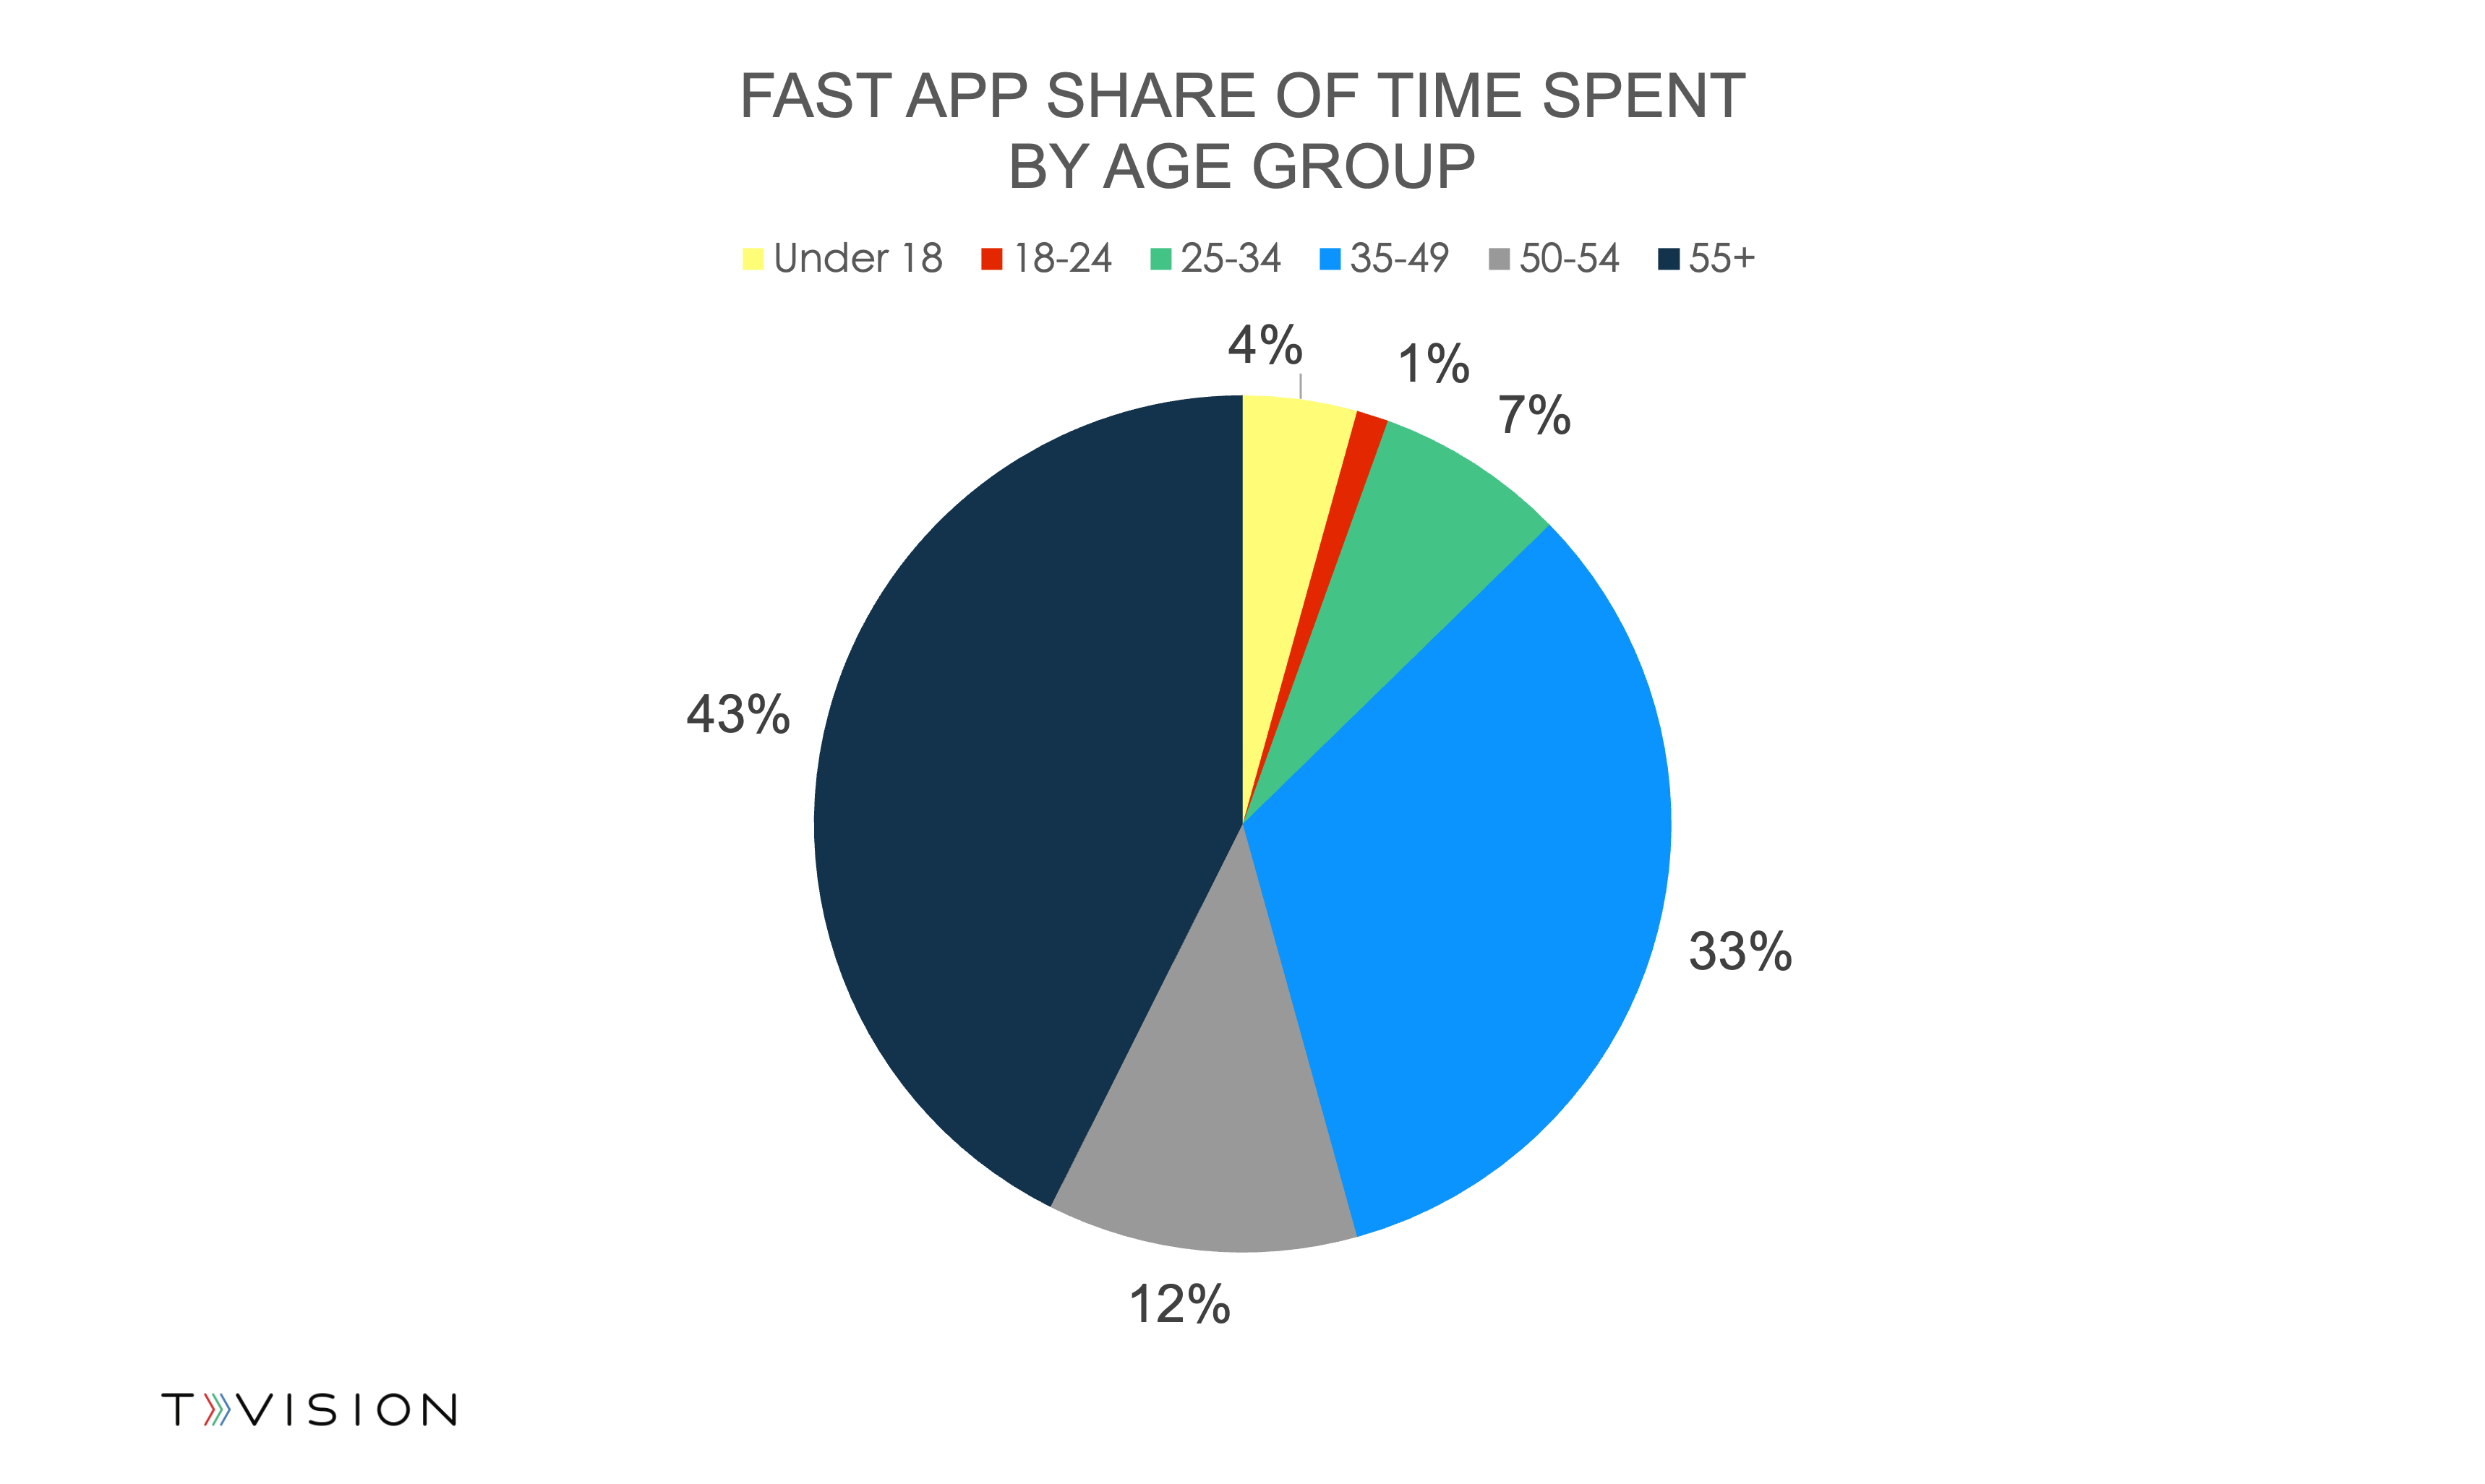
As FAST continues to grow, it’s essential to understand the makeup of the audience, who is engaging, and how they are engaging to target and pinpoint the best opportunities of these applications. FAST app viewers are generally older than average and skew female. Over 50% of time spent came from viewers over 50 and over 90% from viewers 35 or older. This larger age group tends to spend more time on TV overall and be more engaged.
These insights are just scratching the surface of what we explored in our new State of TV Report. Want to learn more about how many people are co-viewing CTV, where to find the most valuable impressions, and how programming impacts engagement? Download the full report today, check out our webinar, and stay tuned for the next installment in our blog series on CTV Co-Viewing.


