IPG Media Lab recently released a new report powered by TVision data: Quantifying TV Attention. Among the findings were that 29% of the time, there’s no one in the room when a TV ad airs. Since the concept of attention indicates whether an ad has the opportunity to be seen, a TV ad airing to an empty room is not viewable.
IPG Media Lab’s report has given the industry a lot to digest - especially with Upfront season upon us. Since every brand is unique, we wanted to understand how these numbers varied across a variety of brands and factors. To dig deeper, we investigated:
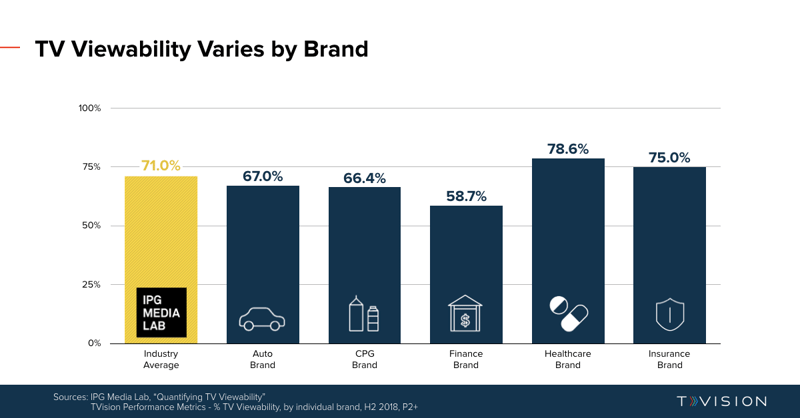
We analyzed five individual brands - across a variety of verticals like Auto, CPG, Finance, Insurance, and Healthcare - to see how they compared with IPG Media Lab’s industry benchmarks. Of the brands we looked at, we found that individual brand TV viewability had a broad range - from as low as 58.7% for a leading finance brand to 78.6% for a healthcare brand - all compared to the 71.0% industry average IPG Media Lab found across all brands and verticals.
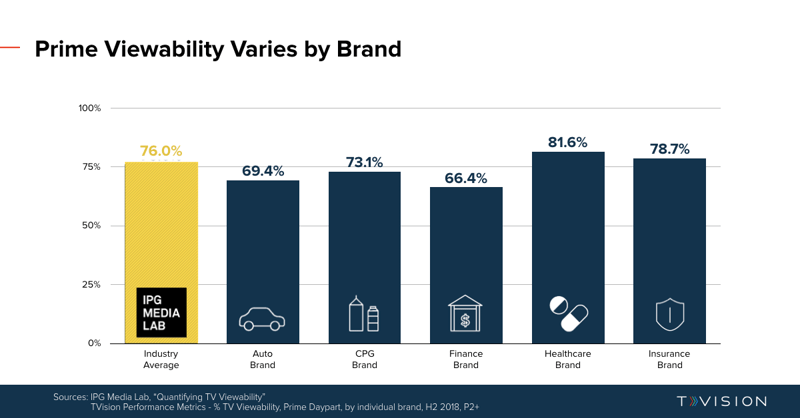
For these specific brands, it’s important to note that their viewability rate reflected all dayparts, pod positions, program genres, and more. When we dug deeper into TV dayparts, looking solely at Prime, we also saw a wide variance across various brands. We found that one CPG brand moved ahead of the Auto brand in TV Viewability.
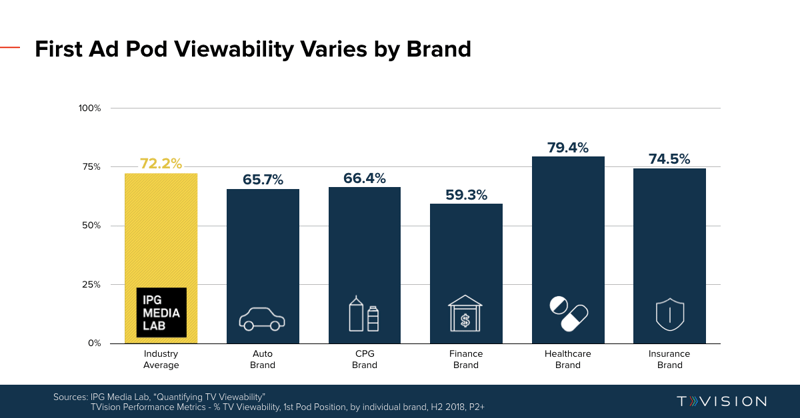
Pod position is also a key factor in TV Attention. While IPG Media Lab saw an average of 72.2% TV Attention for commercials that aired first in pod, the effect of first-in-pod was not the same for everyone.
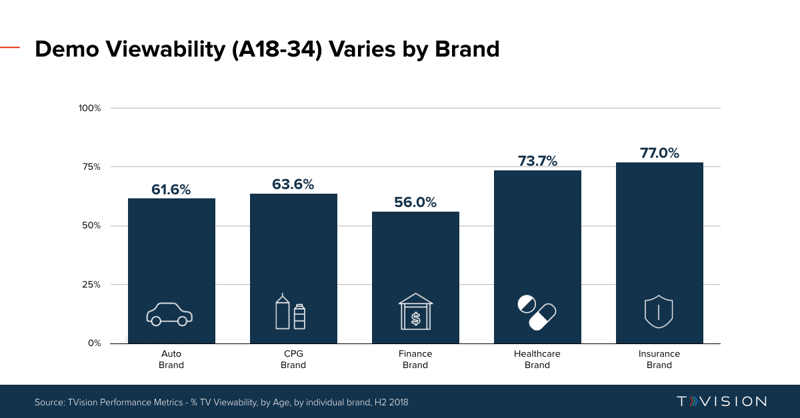
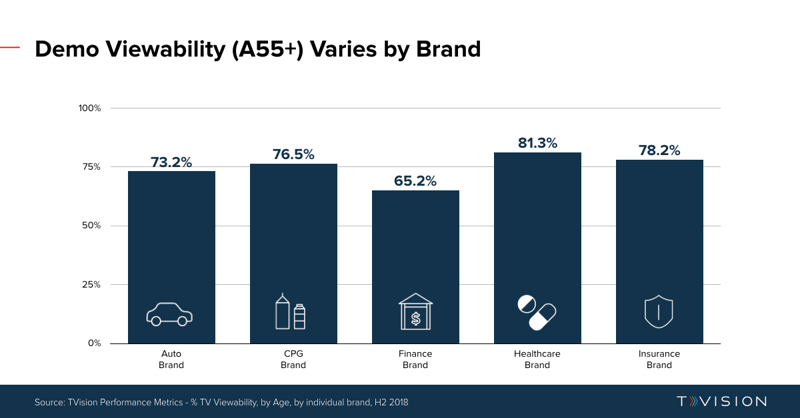
Attention also varies dramatically based on age breakout. As shown below, 55+ attention is significantly higher than each brand’s average. Great if the brands are targeting 55+. Not so great if the brands are targeting younger consumers. While the analyzed brands did not necessarily target Millennials (18-34) or Adults 55+, it is hard for brands to ignore the impact on these large demographic groups.
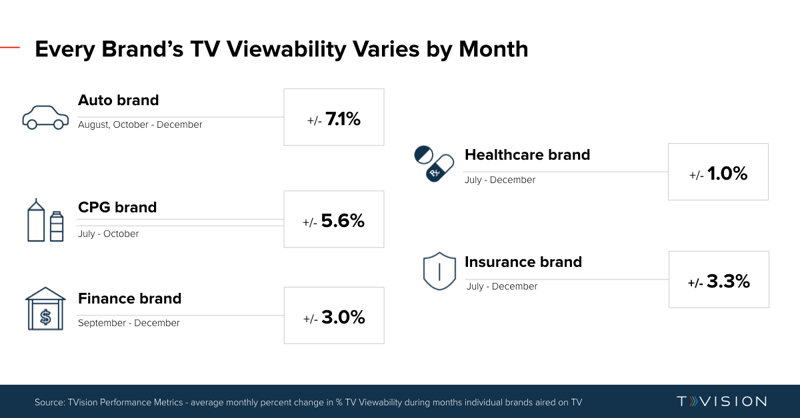
Lastly, we wanted to understand how each brand’s TV Attention varied by month - since TV campaigns are planned and bought across varying periods. By analyzing average percent change by month, we found that every brand saw a range of variance over different campaign periods.
IPG’s Magna estimates that TV spend will reach $58 Billion in 2019, and IPG Media Lab estimates 29% of TV impressions air to an empty room. Seeing the variation in TV Attention from brand to brand, across many different factors, it is clear that simply understanding average performance is not enough. With Upfront season upon us, it is time to understand your brand’s unique performance and plan accordingly.


