We took a look at the top advertisers of the last three months (May 2022-July 2022) across four industries - beverages, auto, pets and credit cards - to see how they scored for attention and viewability to their ad campaigns. We measure the ad effectiveness of the industry's top spenders (according to Media Radar) based on their ability to keep viewers in the room, with their eyes on the screen while the ads are aired.
For the first time, we've included CTV ad attention and viewability scores for these brands as well. TVision's Ad Scoreboard is the only solution available to let advertisers understand their CTV ad engagement on specific apps and against their major competitors. Want to learn more about our low-cost, easy-to-use Ad Scoreboard for measuring TV and CTV ad performance? Reach out.
A hot summer across much of the country means Americans were focused on keeping cool and quenching their thirst. Which advertisers captured viewers' attention? And what can these brands learn from the ad strategies of their peers? Ad Scoreboard provides the answers. Check out the scores below for insight into which brands best-engaged viewers.
*Brands are listed in order by total ad spend, based on Media Radar data.
| Brand | Linear Viewability | Linear Attention | CTV Viewability |
CTV Attention |
 |
 |
 |
 |
 |
 |
 |
 |
|
 |
 |
|
 |
 |
|
 |
|
|
|
|
 |
|
|
 |
|
With auto inventory getting back on track and Americans getting back to the office, consumer interest in the automotive industry may be on the rise. Which brands have the right media and creative mix to capitalize? Check out the scores below for insight into which brands are capturing viewer attention.
*Brands are listed in order by total ad spend, based on Media Radar data.
| Brand | Linear Viewability | Linear Attention | CTV Viewability |
CTV Attention |
 |
 |
|
|
|
 |
|
|
|
|
 |
|
|
|
|
 |
 |
 |
|
|
 |
|
|
|
|
With inflation and economic concerns top of mind with many American consumers, the major credit card companies are seeking to break through the noise and capture the attention of audiences. Below we highlight how the top ad spenders are engaging viewers across linear and CTV.
*Brands are listed in order by total ad spend, based on Media Radar data.
| Brand | Linear Viewability | Linear Attention | CTV Viewability |
CTV Attention |
 |
|
|
|
|
 |
|
|
|
|
 |
|
|
|
|
 |
|
|
|
|
 |
|
|
|
|
Pet owners are among the most brand loyal consumers in the country. Pet care companies use TV and CTV advertising to impact brand awareness and recall, two important metrics that influence both brand loyalty and purchase decisions. Here's how the top advertisers captured attention from May - July 2022.
*Brands are listed in order by total ad spend, based on Media Radar data.
| Brand | Linear Viewability | Linear Attention | CTV Viewability |
CTV Attention |
 |
|
|
|
|
 |
|
|
|
|
 |
|
|
|
|
 |
|
|
|
|
 |
|
|
|
|
The scores in the lists below are pulled directly from our new, easy-to-use platform: Ad Scoreboard.
The scores indicate how well the brand captured attention and viewability over the last three months, compared to all other TV and CTV advertisers. The Scoring System ranges from 1 to 10. For example, a score of 7 indicates that the brand is performing better than 70% of all the brands that TVision measures. Color coding makes it easy to understand at-a-glance: green is above average, yellow is average, and red is below average.
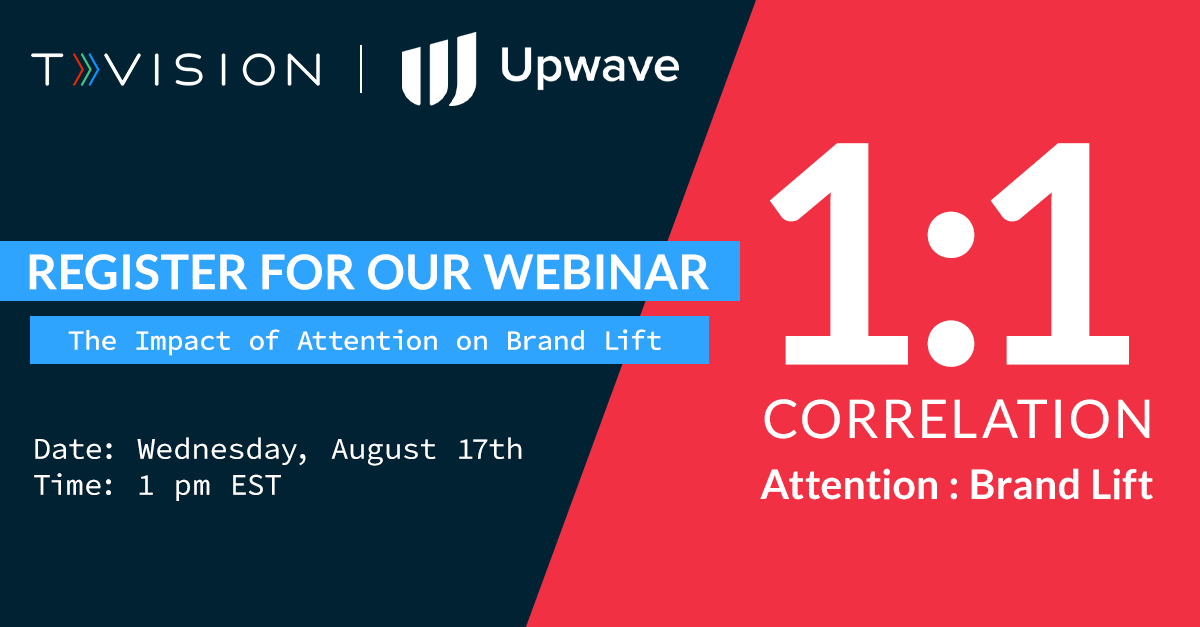
For every 1 percent increase in TV attention, brands see a corresponding 1% increase in aided awareness and brand recall, according to a recent study by TVision and Upwave. You can learn more about the importance of attention in driving brand lift in our upcoming webinar, on August 17 at 1 pm.