The TVision Signal

October 2023 Edition


Our Special Monthly Look at CTV Content & Viewer Trends

October 4, 2023

Welcome to the October 2023 edition of the TVision Signal Report. Think of it as an extended edition of our weekly TVision Power Score. In addition to sharing insight into the shows that are performing best across streaming apps, we're taking a deeper dive into the viewer and content trends shaping the future of the CTV landscape. Want to find out which programs and apps are drawing in audiences and keeping them engaged? Or how the rise of streaming has impacted linear TV viewing? Keep reading to find out!

Catch up on all of our past reports and check out our FAQs to learn more. 


Top 20 CTV Shows of the Week

First let's examine the shows and movies that are ranking highest according to our signature TVision Power Score. Here are the shows that topped the Power Score list between September 25 and October 1, 2023 thanks to their ability to both attract viewers and hold their attention throughout the show.

The TVision Power Score

Ranking the Top CTV Shows for 9/25- 10/1/2023
This Month
Previous Month
Rank Decrease
Rank Increase
Trending Up
 
Source: TVision Total View

"The Morning Show" (S3) from AppleTV+ and Disney+ "Star Wars: Ahsoka" have been battling it out for the top spot in the list for several weeks. This week, Reese Witherspoon and Jennifer Anniston prevailed with the AppleTV+ show gaining the number one ranking in the TVision Power Score. 

Netflix placed seven shows on the list and Amazon had five. 

The Shows With Power Score Staying Power

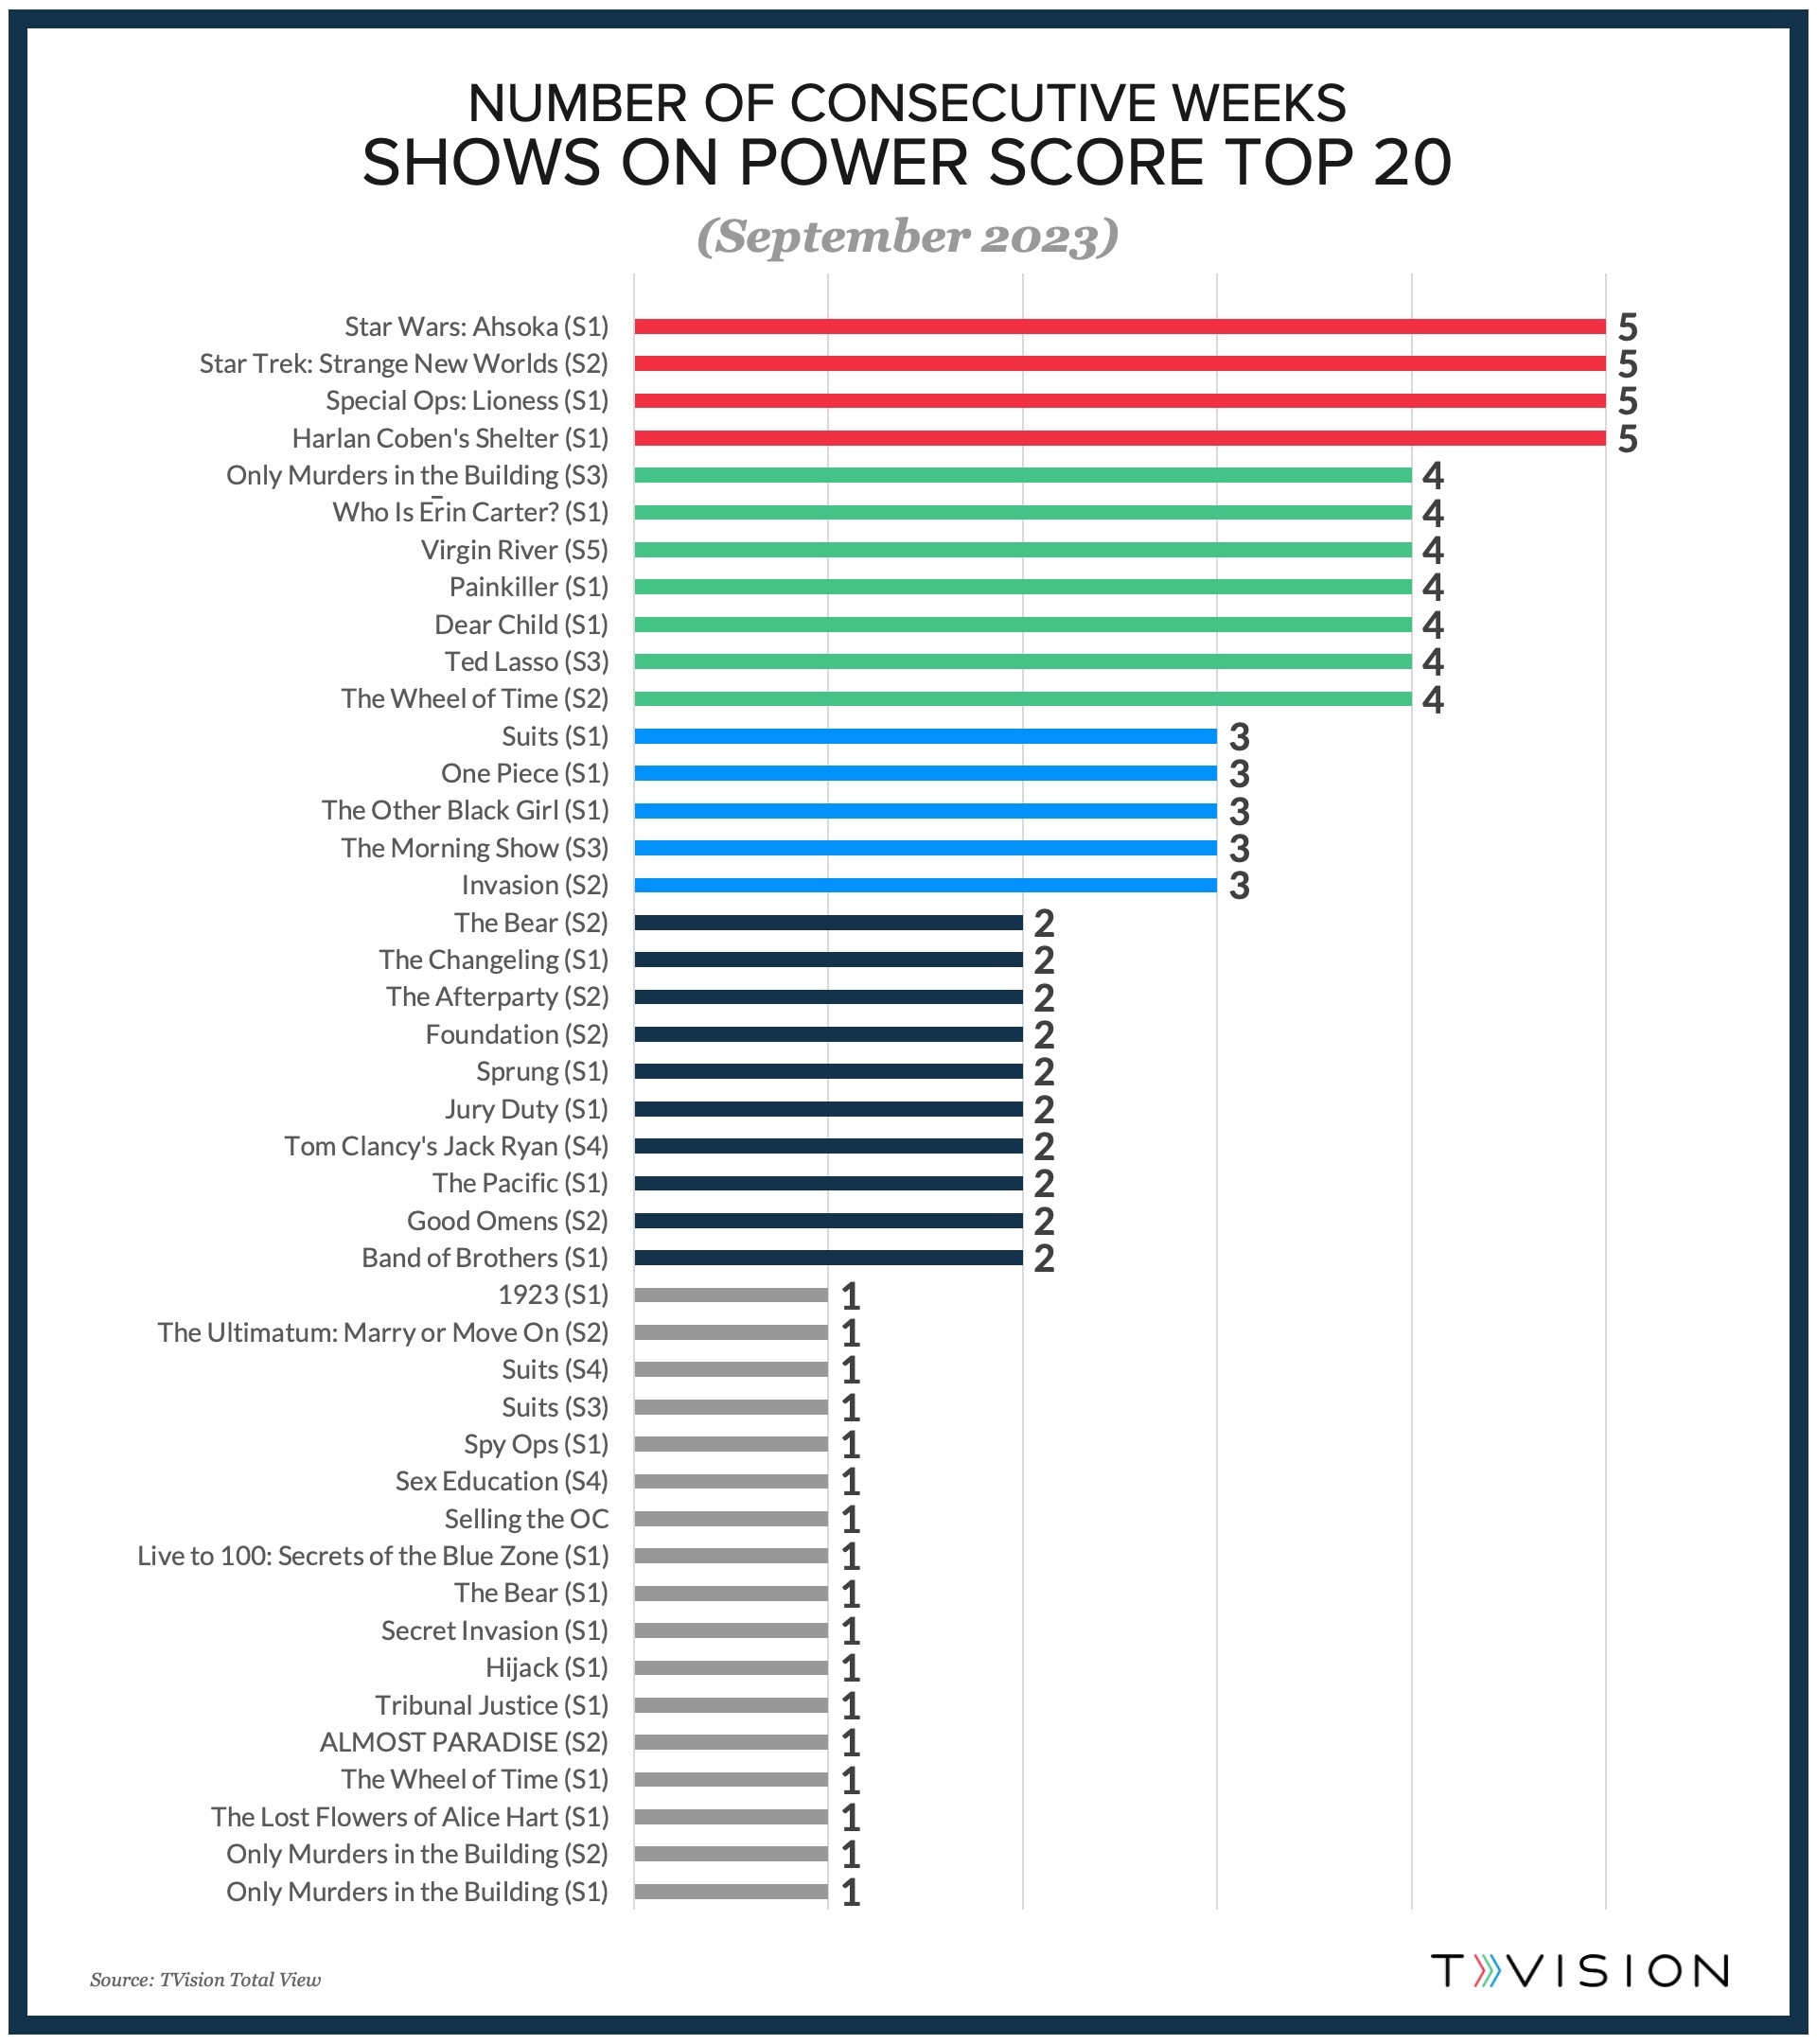
Only four shows made the list in each of the five weeks we counted for September. The full period we measured was August 28- October 1, 2023. Those shows include "Harlan Coben's Shelter" from Amazon, and "Star Wars: Ahsoka" from Disney+. Notably, "Special Ops: Lioness" (S1) and "Star Trek: Strange New Worlds" (S2) from Paramount+ have made the list for ten straight weeks.  Here is a roundup of the CTV shows that remained on the TVision Power Score Top 20 in September for the most consecutive weeks.

tvision_signal-consecutiveweeks_sept 

The Apps Producing Engaging Content

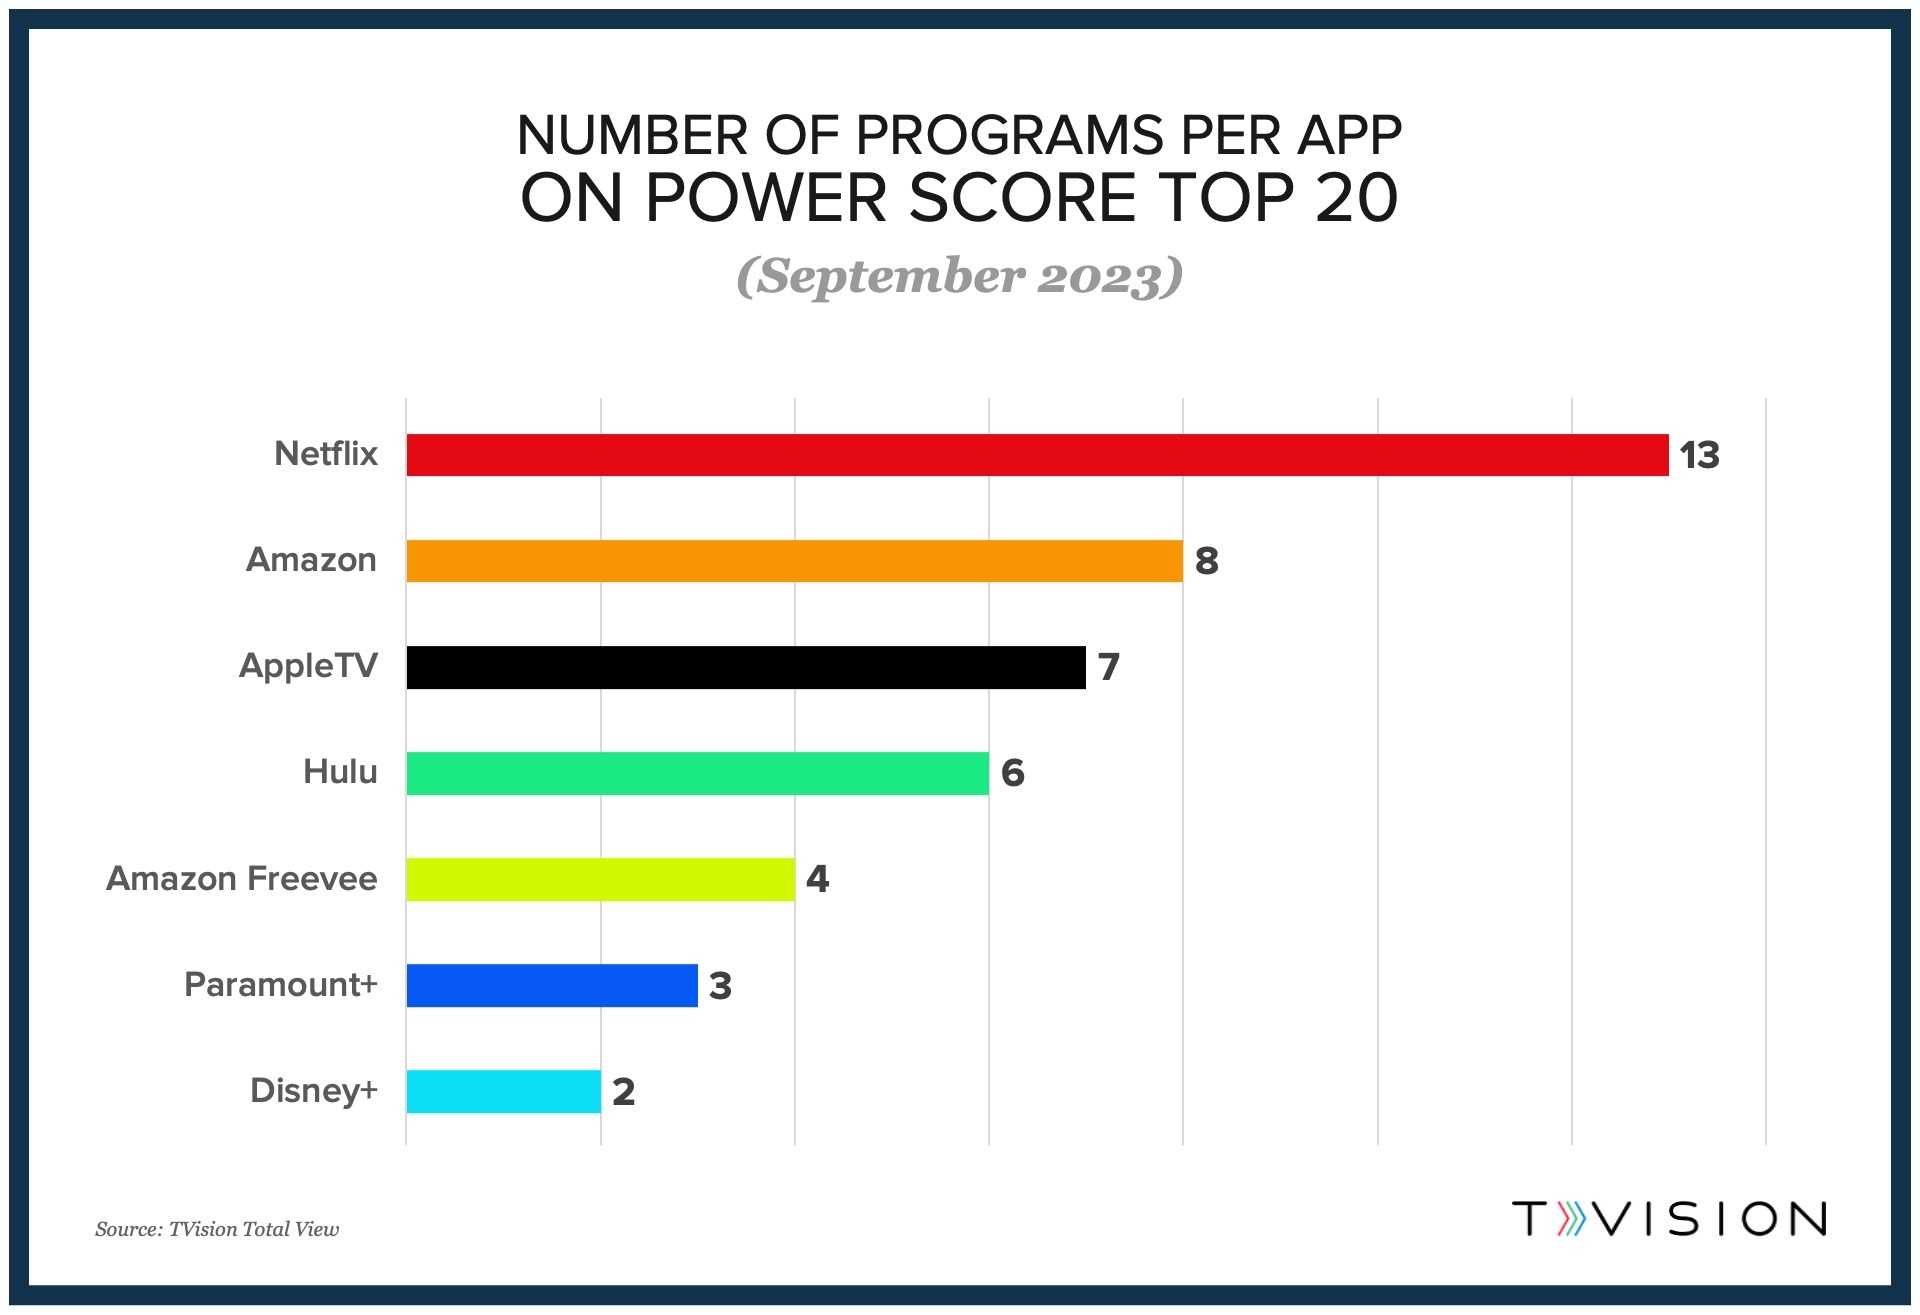
Netflix once again led the list with 13 shows making their way to the TVision Power Score in September. Driving Netflix's dominance were several highly anticipated series returns,  such as Virgin River and Sex Education. Netflix's investment in Suits continues to pay off as viewers cycle through the large library of content. 

Amazon (8 shows) and AppleTV+ (7) also had strong months. 

tvision_signal_monthly-numberprograms-sept


Top 20 CTV Movies of September 2023

Want to know which of this year’s movies are best engaging viewers across all apps? Here are the movies that topped the Power Score list in September.

The TVision Power Score

Ranking the Top CTV Movies for September 2023
This Month
Previous Month
Rank Decrease
Rank Increase
Trending Up
 
Source: TVision Total View

Comedies top the TVision Power Score for September 2023, with Adam Sandler's Netflix movie "You are So Not Invited to My Bat Mitzvah" edging out Hulu's "Vacation Friends 2" for the top spot. 

Disney celebrated the 30th anniversary of  "Tim Burton's Nightmare Before Christmas" with a major refresh and re-release. It landed in the third spot on the list in September, leading all Disney+ movies. In total seven Disney+ shows made the list including "Moana," "Turning Red,"  "Frozen," "Lilo & Stitch," "Encanto," and "Alladin". 

Viewers Watch Both Linear and CTV

While it is still true that the majority of homes are watching both linear and CTV every month, in September we saw an increase in linear-only viewing, perhaps attributed to the return of football.

 
Source: TVision Total View
You can see that Streaming, Cable and Broadcast are all well-represented in panel households. In the month of August, Streaming shot up to 93% of all households. Most households are leveraging two or three options throughout the month to watch the content they want to consume.
 
Source: TVision Total View

Note, Platform Reach indicates TV services households have viewed at least once within the specified time period.

Apps with Ad-Supported Options Gain Share

Data from TVision Total View shows that the largest category of apps - those that offer both ad and ad-free options, such as Netflix, Hulu and Disney+ - continues to gain share.

 
Source: TVision Total View

The Apps On America’s TVs

The top five apps in September 2023 for Household Reach are Netflix, YouTube, Amazon Prime, Hulu and Disney+.  Farther down the list of the top 30 apps for household reach, sports apps. - ESPN, Fox Sports and MLB -  all saw significant bumps, possibly due to the combination of the end of the MLB season and the NFL and college football seasons drawing in more sports fans 

 
Source: TVision Total View

The CTV Content Types Engaging Viewers

While premium content is essential for engaging CTV viewers, a strong assortment of streaming library content is also valuable for application providers looking to attract more viewers. In September we saw an increase in viewers spending time with syndicated programming and older shows in general, perhaps due to the writing and acting strikes slowing down the pace of new content releases.

Shows vs. Movies

89% 11%
Shows Movies

Binged Shows vs. Weekly Release

86% 14%
Binge Release Weekly Release


Original vs. Syndicated Content

55% 45%
Original Syndicated

New Shows vs. Older Shows

10% 90%
New Shows Older Shows
 

Want to learn more about the TVision Signal Report? Check out our FAQs here.

Take Action with TVision Total View

Want more insight into the most engaging programs across CTV? TVision has recently introduced Total View, the industry’s most comprehensive look at person-level viewer engagement across both CTV and linear. With a unified view of the entire TV landscape, media sellers can identify premium impressions based on viewer engagement and show the true value of their media properties. Want to learn how you can gain key engagement metrics like attention and co-viewing for ad performance and viewer trends across hundreds of apps, networks, and thousands of shows? Contact us today to get started or request a demo.

Explore Total View

Methodology & Metrics

TVision measures Viewer Presence and Attention for every second of programming and advertising on television. Every time a person walks into the room, our technology detects who the viewer is, where they are in the room, and what their eyes are looking at. We do all this without personally identifying individual users, and without transmitting any images or videos. TVision’s data is collected from an opt-in panel of 5,000 homes across the United States and weighted to represent the country. All demographic data is self-reported by the respondents. Linear and CTV ad impressions data in this report is from May 1 – May 31, 2023 or May 29 – June 4, 2023, unless otherwise indicated.

About the TVision Power Score

The TVision Power Score is a completely new ranking designed to factor in both viewership and engagement when measuring the performance of CTV programming. The Power Score is based on the industry’s most comprehensive view of the CTV landscape - TVision measures activity across over 1,000 apps - and enables an accurate understanding of the relative performance of CTV content across any app. This new way to understand show performance will enable industry watchers to more quickly identify trending content and CTV’s hottest programming and even uncover hidden gems distributed through smaller apps.

The TVision Power Score factors in four key metrics: the amount of time viewers pay attention to the program, the amount of program time available for the season, the program’s reach, as well as the application’s reach. This combination of metrics was chosen to enable a neutral look at the quality of programming and its unique, inherent ability to draw in viewers - regardless of the scale of the platform, or the program’s release schedule.

TVision Metrics

TVision Power Score: TVision's Power Score represents how engaged audiences are for any given program. Our formula looks at (Attentive seconds / Seconds Available) x (Program Reach per Season / Publisher Reach).

Share of Time Spent: Compares the distribution of time spent viewing the app or program relative to the selected variable.

Binge Release: Model in which multiple episodes in a season are released at the same time

Weekly Release: Model in which shows release one new episode in a season at a time over the course of several weeks

New Shows: Show has aired new episodes within the last 30 days Older Shows: Shows has not aired new episodes in the last 30 days

Original Content: Programs that are exclusive to a single platform

Syndicated Content/Streaming Library Content: Programs that airs on multiple CTV platforms or have their entire suite of content available.


Back To Top